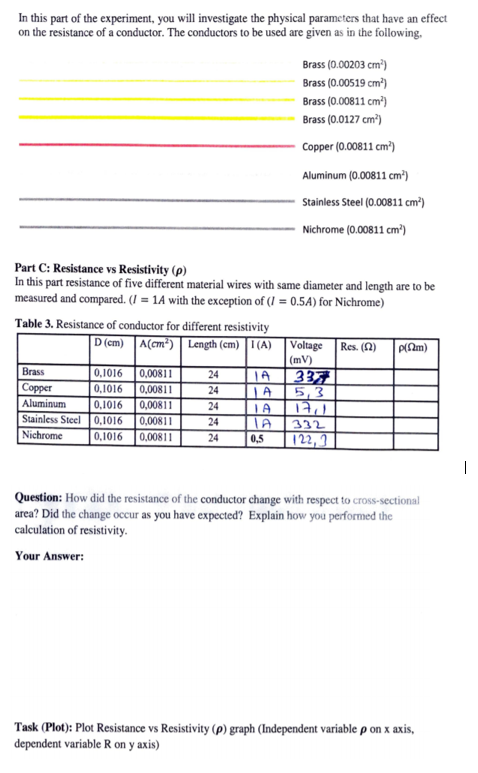
In this part of the experiment, you will investigate the physical parameters that have an effect on the resistance of a conductor. The conductors to be used are given as in the following. Brass (0.00203 cm") Brass (0.00519 cm³) Brass (0.00811 cm³) Brass (0.0127 cm') Copper (0.00811 cm³) Aluminum (0.00811 cm³) Stainless Steel (0.00811 cm³) Nichrome (0.00811 cm') Part C: Resistance vs Resistivity (p) In this part resistance of five different material wires with same diameter and length are to be measured and compared. (I = 1A with the exception of (I = 0.54) for Nichrome) Table 3. Resistance of conductor for different resistivity D (cm) A(cm) Length (cm) 1 (A) Voltage |(mV) 337 5,3 TA Res. (2) Pm) Brass Copper Aluminum Stainless Steel 0,1016 Nichrome 0,00811 0,00811 0,00811 0,1016 24 0,1016 24 0,1016 24 0,00811 24 332 0,1016 0,00811 24 122, ? 0,5 Question: How did the resistance of the conductor change with respect to cross-sectional area? Did the change occur as you have expected? Explain how you performed the calculation of resistivity. Your Answer: Task (Plot): Plot Resistance vs Resistivity (p) graph (Independent variable p on x axis, dependent variable R on y axis)
In this part of the experiment, you will investigate the physical parameters that have an effect on the resistance of a conductor. The conductors to be used are given as in the following. Brass (0.00203 cm") Brass (0.00519 cm³) Brass (0.00811 cm³) Brass (0.0127 cm') Copper (0.00811 cm³) Aluminum (0.00811 cm³) Stainless Steel (0.00811 cm³) Nichrome (0.00811 cm') Part C: Resistance vs Resistivity (p) In this part resistance of five different material wires with same diameter and length are to be measured and compared. (I = 1A with the exception of (I = 0.54) for Nichrome) Table 3. Resistance of conductor for different resistivity D (cm) A(cm) Length (cm) 1 (A) Voltage |(mV) 337 5,3 TA Res. (2) Pm) Brass Copper Aluminum Stainless Steel 0,1016 Nichrome 0,00811 0,00811 0,00811 0,1016 24 0,1016 24 0,1016 24 0,00811 24 332 0,1016 0,00811 24 122, ? 0,5 Question: How did the resistance of the conductor change with respect to cross-sectional area? Did the change occur as you have expected? Explain how you performed the calculation of resistivity. Your Answer: Task (Plot): Plot Resistance vs Resistivity (p) graph (Independent variable p on x axis, dependent variable R on y axis)

Physics for Scientists and Engineers: Foundations and Connections
1st Edition
ISBN:9781133939146
Author:Katz, Debora M.
Publisher:Katz, Debora M.
Chapter28: Current And Resistance
Section: Chapter Questions
Problem 69PQ

Related questions
Question
pls help me )
Transcribed Image Text:In this part of the experiment, you will investigate the physical parameters that have an effect
on the resistance of a conductor. The conductors to be used are given as in the following.
Brass (0.00203 cm")
Brass (0.00519 cm³)
Brass (0.00811 cm³)
Brass (0.0127 cm³)
Copper (0.00811 cm²)
Aluminum (0.00811 cm")
Stainless Steel (0.00811 cm³)
Nichrome (0.00811 cm*)
Part C: Resistance vs Resistivity (p)
In this part resistance of five different material wires with same diameter and length are to be
measured and compared. (I = 1A with the exception of (I = 0.54) for Nichrome)
Table 3. Resistance of conductor for different resistivity
D (cm) A(cm) Length (cm)I(A)
Voltage
Res. (2)
PAm)
(mV)
Brass
Copper
0,1016
0,1016
0,00811
337
5,3
17,1
24
0,00811
24
0,00811
0,00811
Aluminum
0,1016
Stainless Steel0,1016
24
IA
24
332
Nichrome
0,1016
122, 3
0,0081
24
0,5
Question: How did the resistance of the conductor change with respect to cross-sectional
area? Did the change occur as you have expected? Explain how you performed the
calculation of resistivity.
Your Answer:
Task (Plot): Plot Resistance vs Resistivity (p) graph (Independent variable p on x axis,
dependent variable R on y axis)
Expert Solution
This question has been solved!
Explore an expertly crafted, step-by-step solution for a thorough understanding of key concepts.

Step by step
Solved in 2 steps with 2 images

Knowledge Booster


Learn more about
Need a deep-dive on the concept behind this application? Look no further. Learn more about this topic, physics and related others by exploring similar questions and additional content below.Recommended textbooks for you
Physics for Scientists and Engineers: Foundations…
Physics
ISBN:
9781133939146
Author:
Katz, Debora M.
Publisher:
Cengage Learning

Physics for Scientists and Engineers: Foundations…
Physics
ISBN:
9781133939146
Author:
Katz, Debora M.
Publisher:
Cengage Learning