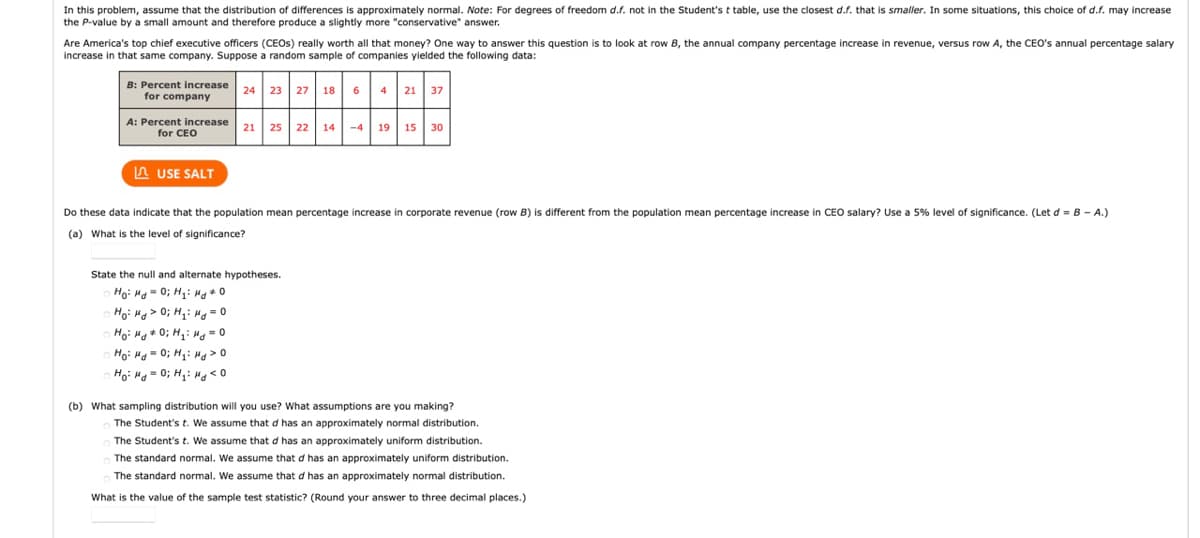
In this problem, assume that the distribution of differences is approximately normal. Note: For degrees of freedom d.f. not in the Student's t table, use the closest d.f. that is smaller. In some situations, this choice of d.f. may increase the P-value by a small amount and therefore produce a slightly more "conservative" answer. Are America's top chief executive officers (CEOS) really worth all that money? One way to answer this question is to look at row B, the annual company percentage increase in revenue, versus row A, the CEO's annual percentage salary increase in that same company. Suppose a random sample of companies yielded the following data: B: Percent increase for company 24 23 27 18 6 4 21 37 A: Percent increase for CEO 21 25 22 14 -4 19 15 30 A USE SALT Do these data indicate that the population mean percentage increase in corporate revenue (row B) is different from the population mean percentage increase in CEO salary? Use a 5% level of significance. (Let d = B - A.) (a) What is the level of significance? State the null and alternate hypotheses. Ho: Ha- 0; H: Hg*0 Ho: Hg> 0; Hq: Hg -0 Hoi Hg* 0; Hqi Mg = 0 Hoi Hg - 0; H,: Hg < 0 (b) What sampling distribution will you use? What assumptions are you making? The Student's t. We assume that d has an approximately normal distribution. The Student's t. We assume that d has an approximately uniform distribution. The standard normal. We assume that d has an approximately uniform distribution. The standard normal. We assume that d has an approximately normal distribution. What is the value of the sample test statistic? (Round your answer to three decimal places.)
In this problem, assume that the distribution of differences is approximately normal. Note: For degrees of freedom d.f. not in the Student's t table, use the closest d.f. that is smaller. In some situations, this choice of d.f. may increase the P-value by a small amount and therefore produce a slightly more "conservative" answer. Are America's top chief executive officers (CEOS) really worth all that money? One way to answer this question is to look at row B, the annual company percentage increase in revenue, versus row A, the CEO's annual percentage salary increase in that same company. Suppose a random sample of companies yielded the following data: B: Percent increase for company 24 23 27 18 6 4 21 37 A: Percent increase for CEO 21 25 22 14 -4 19 15 30 A USE SALT Do these data indicate that the population mean percentage increase in corporate revenue (row B) is different from the population mean percentage increase in CEO salary? Use a 5% level of significance. (Let d = B - A.) (a) What is the level of significance? State the null and alternate hypotheses. Ho: Ha- 0; H: Hg*0 Ho: Hg> 0; Hq: Hg -0 Hoi Hg* 0; Hqi Mg = 0 Hoi Hg - 0; H,: Hg < 0 (b) What sampling distribution will you use? What assumptions are you making? The Student's t. We assume that d has an approximately normal distribution. The Student's t. We assume that d has an approximately uniform distribution. The standard normal. We assume that d has an approximately uniform distribution. The standard normal. We assume that d has an approximately normal distribution. What is the value of the sample test statistic? (Round your answer to three decimal places.)

Glencoe Algebra 1, Student Edition, 9780079039897, 0079039898, 2018
18th Edition
ISBN:9780079039897
Author:Carter
Publisher:Carter
Chapter10: Statistics
Section10.4: Distributions Of Data
Problem 19PFA

Related questions
Question
Help me answer the questions in the picture with the following information (Data in Pictures):
In this problem, assume that the distribution of differences is approximately normal. Note: For degrees of freedom d.f. not in the Student's t table, use the closest d.f. that is smaller. In some situations, this choice of d.f. may increase the P-value by a small amount and therefore produce a slightly more "conservative" answer.
Are America's top chief executive officers (CEOs) really worth all that money? One way to answer this question is to look at row B, the annual company percentage increase in revenue, versus row A, the CEO's annual percentage salary increase in that same company. Suppose a random sample of companies yielded the following data:
Transcribed Image Text:In this problem, assume that the distribution of differences is approximately normal. Note: For degrees of freedom d.f. not in the Student'st table, use the closest d.f. that is smaller. In some situations, this choice of d.f. may increase
the P-value by a small amount and therefore produce a slightly more "conservative" answer.
Are America's top chief executive officers (CEOS) really worth all that money? One way to answer this question is to look at row B, the annual company percentage increase in revenue, versus row A, the CEO's annual percentage salary
increase in that same company. Suppose a random sample of companies yielded the following data:
B: Percent increase
for company
4 21 37
24 23 27 18
6
A: Percent increase
for CEO
21 25
22 14-4
19 15
30
A USE SALT
Do these data indicate that the population mean percentage increase in corporate revenue (row
is different from the population mean percentage increase in CEO salary? Use a 5% level of significance. (Let d = B - A.)
(a) What is the level of significance?
State the null and alternate hypotheses.
Ho: Hg = 0; H,i Mg0
Ho: Hg > 0; H,: H = 0
Ho: Ha+ 0; H: Hg -0
Hoi Hg = 0; H,: Hg > 0
Ho: H = 0; H,: Hg < 0
(b) What sampling distribution will you use? What assumptions are you making?
The Student's t. We assume that d has an approximately normal distribution.
The Student's t. We assume that d has an approximately uniform distribution.
The standard normal. We assume that d has an approximately uniform distribution.
The standard normal. We assume that d has an approximately normal distribution.
What is the value of the sample test statistic? (Round your answer to three decimal places.)
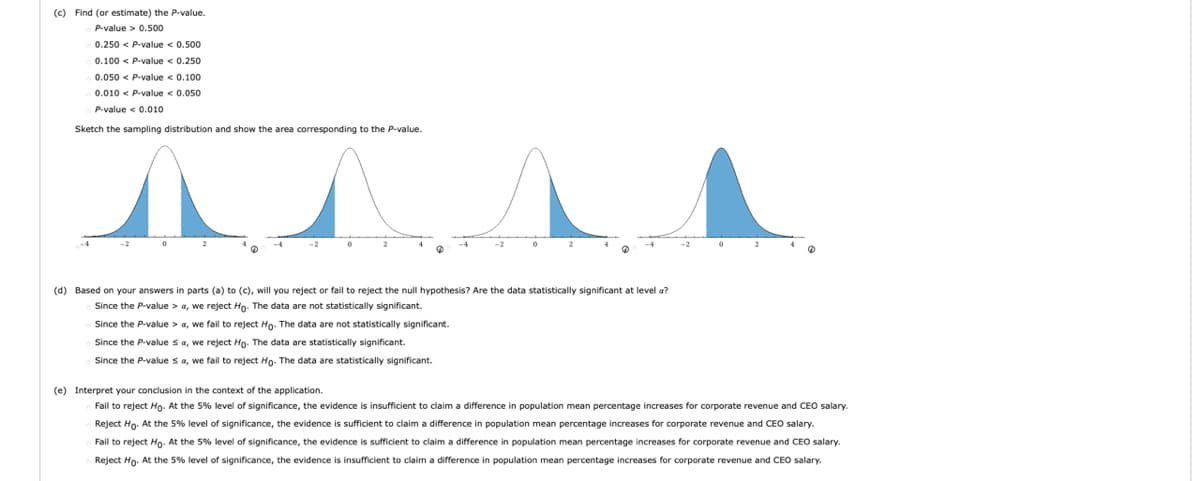
Transcribed Image Text:(c) Find (or estimate) the P-value.
P-value > 0.500
0.250 < P-value < 0.500
0.100 < P-value < 0.250
0.050 < P-value < 0.100
0.010 < P-value < 0.050
P-value < 0.010
Sketch the sampling distribution and show the area corresponding to the P-value.
(d) Based on your answers in parts (a) to (c), will you reject or fail to reject the null hypothesis? Are the data statistically significant at level a?
Since the P-value > a, we reject Ho. The data are not statistically significant.
Since the P-value > a, we fail to reject Ho. The data are not statistically significant.
Since the P-value sa, we reject Ho. The data are statistically significant.
Since the P-value s a, we fail to reject Ho. The data are statistically significant.
(e) Interpret your conclusion in the context of the application.
Fail to reject Hg.- At the 5% level of significance, the evidence is insufficient to claim a difference in population mean percentage increases for corporate revenue and CEO salary.
Reject Ho. At the 5% level of significance, the evidence is sufficient to claim a difference in population mean percentage increases for corporate revenue and CEO salary.
Fail to reject Ho. At the 5% level of significance, the evidence is sufficient to claim a difference in population mean percentage increases for corporate revenue and CEO salary.
Reject Ho. At the 5% level of significance, the evidence is insufficient to claim a difference in population mean percentage increases for corporate revenue and CEO salary.
Expert Solution
This question has been solved!
Explore an expertly crafted, step-by-step solution for a thorough understanding of key concepts.

Step by step
Solved in 2 steps with 1 images

Recommended textbooks for you
Glencoe Algebra 1, Student Edition, 9780079039897…
Algebra
ISBN:
9780079039897
Author:
Carter
Publisher:
McGraw Hill
Glencoe Algebra 1, Student Edition, 9780079039897…
Algebra
ISBN:
9780079039897
Author:
Carter
Publisher:
McGraw Hill