INDTAP Connect - Class:. H Mail - Sanchez, B. nework 7 (Chapter 14) - Part A Q Search this COL The Wall Street Journal asked Concur Technologies, Inc., an expense managèment company, to examine data from 8.3 million expense reports to provide insights regarding business travel expenses. Their analysis of the data showed that New York was the most expensive city. The following table shows the average daily hotel room rate (2) and the average amount spent on entertainment (y) for a random sample of 9 of the 25 most-visited U.S. cities. These data lead to the estimated regression equation û = 17.49 +1.0334. For these data SSE = 1541.4. %3D %3D Click on the datafile logo to reference the data. Use Table 1 of Appendix B. DATA file Room Rate Entertainment City ($) ($) Boston 148 161 96 105 Denver Nashville 91 101 110 142 New Orleans 90 100 Phoenix 102 120 San Diego 136 167 San Francisco 90 140 San Jose 82 98 Tampa a. Predict the amount spent on entertainment for a particular city that has a daily room rate of $89 (to 2 decimals). c. The average room rate in Chicago is $128. Develop a 95% prediction interval for the amount spent on entertainment in Chicago (to 2 decimals). %24 b. Develop a 95% confidence interval for the mean amount spent on entertainment for all cities that have a daily room rate of $89 (to 2 decimals). 2$ to $ to $ MacBook Air F12 F11 DD E10
INDTAP Connect - Class:. H Mail - Sanchez, B. nework 7 (Chapter 14) - Part A Q Search this COL The Wall Street Journal asked Concur Technologies, Inc., an expense managèment company, to examine data from 8.3 million expense reports to provide insights regarding business travel expenses. Their analysis of the data showed that New York was the most expensive city. The following table shows the average daily hotel room rate (2) and the average amount spent on entertainment (y) for a random sample of 9 of the 25 most-visited U.S. cities. These data lead to the estimated regression equation û = 17.49 +1.0334. For these data SSE = 1541.4. %3D %3D Click on the datafile logo to reference the data. Use Table 1 of Appendix B. DATA file Room Rate Entertainment City ($) ($) Boston 148 161 96 105 Denver Nashville 91 101 110 142 New Orleans 90 100 Phoenix 102 120 San Diego 136 167 San Francisco 90 140 San Jose 82 98 Tampa a. Predict the amount spent on entertainment for a particular city that has a daily room rate of $89 (to 2 decimals). c. The average room rate in Chicago is $128. Develop a 95% prediction interval for the amount spent on entertainment in Chicago (to 2 decimals). %24 b. Develop a 95% confidence interval for the mean amount spent on entertainment for all cities that have a daily room rate of $89 (to 2 decimals). 2$ to $ to $ MacBook Air F12 F11 DD E10

Functions and Change: A Modeling Approach to College Algebra (MindTap Course List)
6th Edition
ISBN:9781337111348
Author:Bruce Crauder, Benny Evans, Alan Noell
Publisher:Bruce Crauder, Benny Evans, Alan Noell
Chapter5: A Survey Of Other Common Functions
Section5.3: Modeling Data With Power Functions
Problem 6E: Urban Travel Times Population of cities and driving times are related, as shown in the accompanying...

Related questions
Question
Transcribed Image Text:MINDTAP
Connect - Class:.
H Mail - Sanchez, B.
nework 7 (Chapter 14) - Part A
Q Search this COL
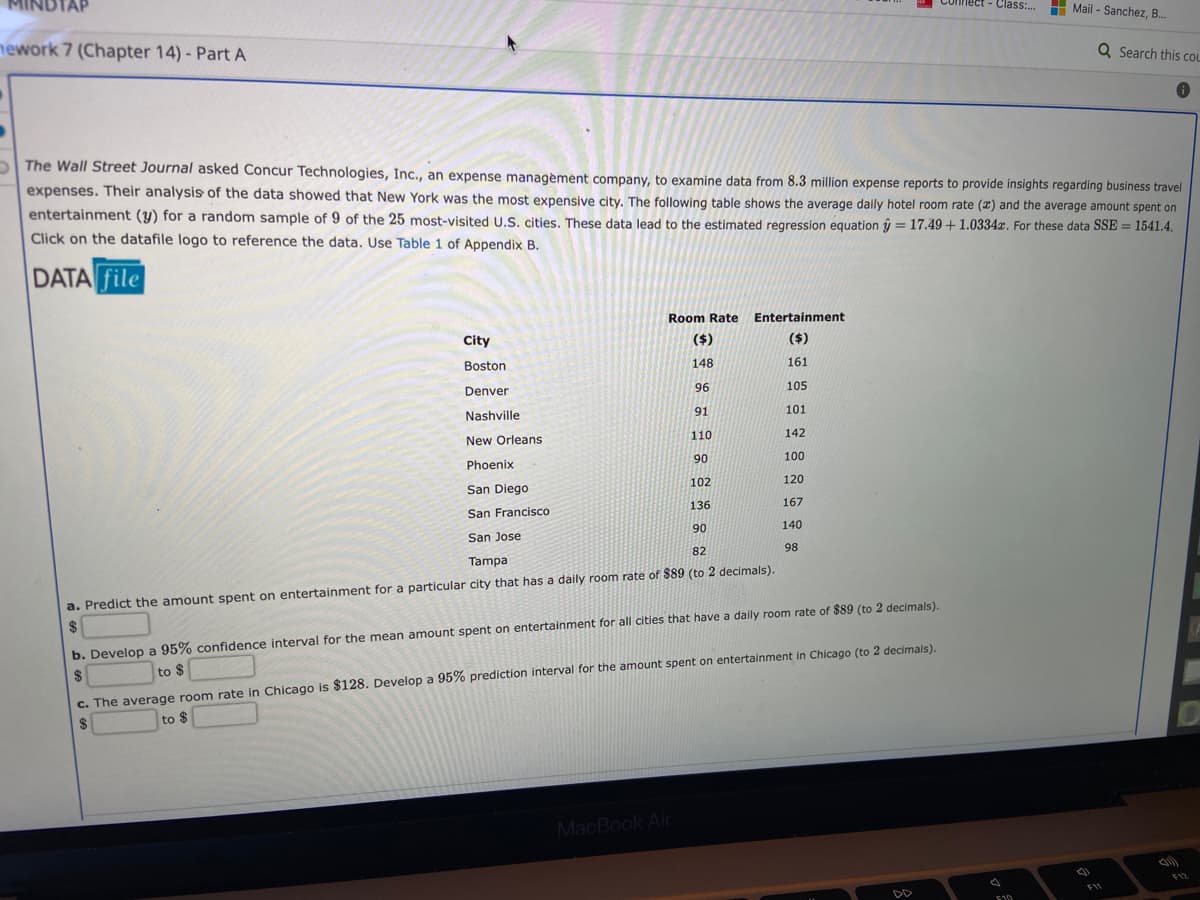
The Wall Street Journal asked Concur Technologies, Inc., an expense managèment company, to examine data from 8.3 million expense reports to provide insights regarding business travel
expenses. Their analysis of the data showed that New York was the most expensive city. The following table shows the average daily hotel room rate (2) and the average amount spent on
entertainment (y) for a random sample of 9 of the 25 most-visited U.S. cities. These data lead to the estimated regression equation û = 17.49 + 1.0334x. For these data SSE = 1541.4.
Click on the datafile logo to reference the data. Use Table 1 of Appendix B.
%3D
%3D
DATA file
Room Rate
Entertainment
City
($)
($)
Boston
148
161
Denver
96
105
Nashville
91
101
New Orleans
110
142
Phoenix
90
100
San Diego
102
120
San Francisco
136
167
90
140
San Jose
82
98
Tampa
a. Predict the amount spent on entertainment for a particular city that has a daily room rate of $89 (to 2 decimals).
2$
b. Develop a 95% confidence interval for the mean amount spent on entertainment for all cities that have a daily room rate of $89 (to 2 decimals).
$
to $
c. The average room rate in Chicago is $128. Develop a 95% prediction interval for the amount spent on entertainment in Chicago (to 2 decimals).
to $
MacBook Air
F12
F11
DD
E10
Expert Solution
This question has been solved!
Explore an expertly crafted, step-by-step solution for a thorough understanding of key concepts.

This is a popular solution!

Trending now
This is a popular solution!

Step by step
Solved in 2 steps with 2 images

Recommended textbooks for you
Functions and Change: A Modeling Approach to Coll…
Algebra
ISBN:
9781337111348
Author:
Bruce Crauder, Benny Evans, Alan Noell
Publisher:
Cengage Learning

Glencoe Algebra 1, Student Edition, 9780079039897…
Algebra
ISBN:
9780079039897
Author:
Carter
Publisher:
McGraw Hill

Big Ideas Math A Bridge To Success Algebra 1: Stu…
Algebra
ISBN:
9781680331141
Author:
HOUGHTON MIFFLIN HARCOURT
Publisher:
Houghton Mifflin Harcourt
Functions and Change: A Modeling Approach to Coll…
Algebra
ISBN:
9781337111348
Author:
Bruce Crauder, Benny Evans, Alan Noell
Publisher:
Cengage Learning
Glencoe Algebra 1, Student Edition, 9780079039897…
Algebra
ISBN:
9780079039897
Author:
Carter
Publisher:
McGraw Hill
Big Ideas Math A Bridge To Success Algebra 1: Stu…
Algebra
ISBN:
9781680331141
Author:
HOUGHTON MIFFLIN HARCOURT
Publisher:
Houghton Mifflin Harcourt