Industrial Une Gross Domestic Product Production Forecast Forecast Latest Qtr Qtr 2015e 2016e Recent Qtr 4.3 % 3.8 % 4.1 % 3.5 % 4.6 % 1.6 % -1.2 % 2.0 % 1.9 % 4.3 % 1.9 % 3.8 % 2.0 % 2.2 % 1.9 % Consumer Prices Interest Rate Forecast 3-month Year Ago Latest 2015e Latest 4.0 % 2.1 % 2.4 % 6.90 % 0.9 % -0.2 % 0.0 % 0.73 % 2.1 % 2.8 % 2.8 % 4.72 %
Industrial Une Gross Domestic Product Production Forecast Forecast Latest Qtr Qtr 2015e 2016e Recent Qtr 4.3 % 3.8 % 4.1 % 3.5 % 4.6 % 1.6 % -1.2 % 2.0 % 1.9 % 4.3 % 1.9 % 3.8 % 2.0 % 2.2 % 1.9 % Consumer Prices Interest Rate Forecast 3-month Year Ago Latest 2015e Latest 4.0 % 2.1 % 2.4 % 6.90 % 0.9 % -0.2 % 0.0 % 0.73 % 2.1 % 2.8 % 2.8 % 4.72 %

Chapter18: Introduction To Macroeconomics: Unemployment, Inflation, And Economic Fluctuations
Section: Chapter Questions
Problem 13P

Related questions
Question
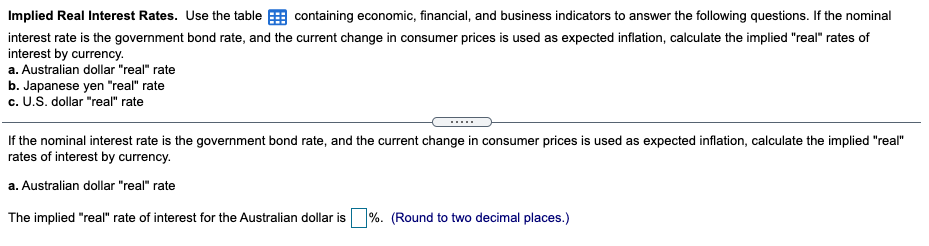
Transcribed Image Text:Implied Real Interest Rates. Use the table
containing economic, financial, and business indicators to answer the following questions. If the nominal
interest rate is the government bond rate, and the current change in consumer prices is used as expected inflation, calculate the implied "real" rates of
interest by currency.
a. Australian dollar "real" rate
b. Japanese yen "real" rate
c. U.S. dollar "real" rate
If the nominal interest rate is the government bond rate, and the current change in consumer prices is used as expected inflation, calculate the implied "real"
rates of interest by currency.
a. Australian dollar "real" rate
The implied "real" rate of interest for the Australian dollar is %. (Round to two decimal places.)
Transcribed Image Text:11/17/21, 1:55 AM
Data Table
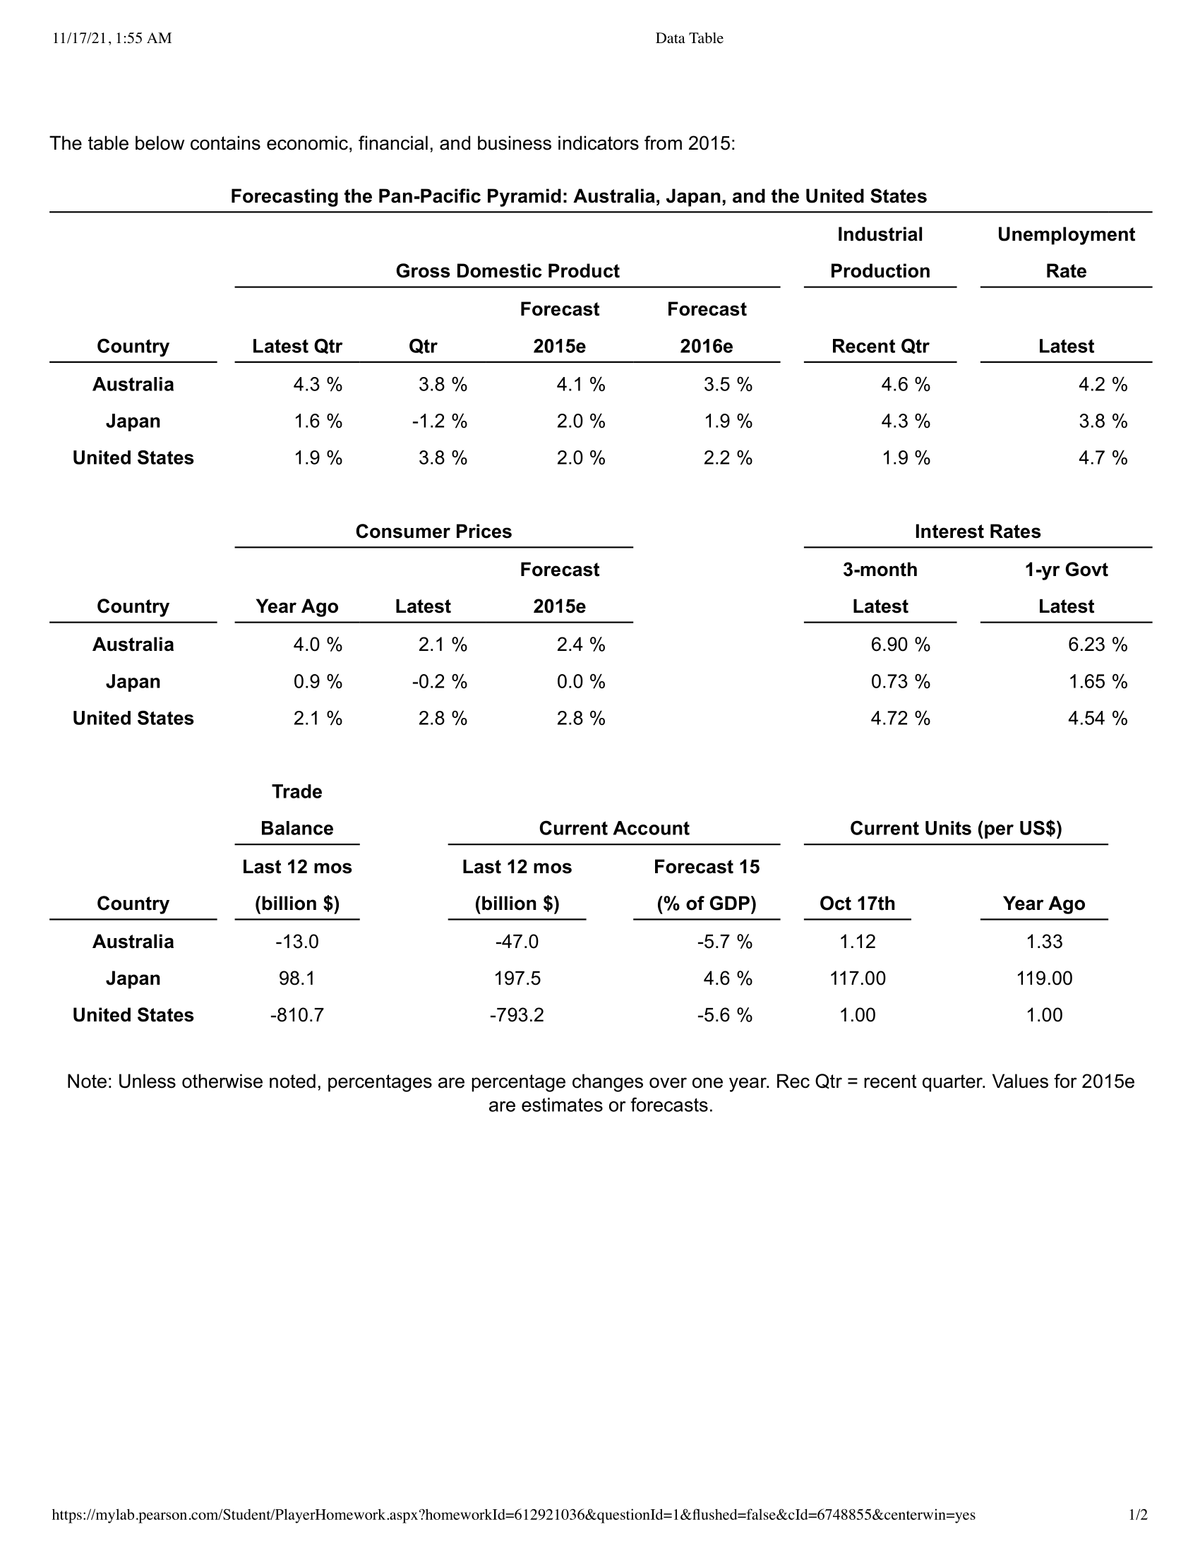
The table below contains economic, financial, and business indicators from 2015:
Forecasting the Pan-Pacific Pyramid: Australia, Japan, and the United States
Industrial
Unemployment
Gross Domestic Product
Production
Rate
Forecast
Forecast
Country
Latest Qtr
Qtr
2015e
2016e
Recent Qtr
Latest
Australia
4.3 %
3.8 %
4.1 %
3.5 %
4.6 %
4.2 %
Jаpan
1.6 %
-1.2 %
2.0 %
1.9 %
4.3 %
3.8 %
United States
1.9 %
3.8 %
2.0 %
2.2 %
1.9 %
4.7 %
Consumer Prices
Interest Rates
Forecast
3-month
1-yr Govt
Country
Year Ago
Latest
2015e
Latest
Latest
Australia
4.0 %
2.1 %
2.4 %
6.90 %
6.23 %
Japan
0.9 %
-0.2 %
0.0 %
0.73 %
1.65 %
United States
2.1 %
2.8 %
2.8 %
4.72 %
4.54 %
Trade
Balance
Current Account
Current Units (per US$)
Last 12 moS
Last 12 mos
Forecast 15
Country
(billion $)
(billion $)
(% of GDP)
Oct 17th
Year Ago
Australia
-13.0
-47.0
-5.7 %
1.12
1.33
Japan
98.1
197.5
4.6 %
117.00
119.00
United States
-810.7
-793.2
-5.6 %
1.00
1.00
Note: Unless otherwise noted, percentages are percentage changes over one year. Rec Qtr = recent quarter. Values for 2015e
are estimates or forecasts.
https://mylab.pearson.com/Student/PlayerHomework.aspx?homeworkId=612921036&questionId=1&flushed=false&cId=6748855¢erwin=yes
1/2
Expert Solution
This question has been solved!
Explore an expertly crafted, step-by-step solution for a thorough understanding of key concepts.

Step by step
Solved in 2 steps

Knowledge Booster


Learn more about
Need a deep-dive on the concept behind this application? Look no further. Learn more about this topic, economics and related others by exploring similar questions and additional content below.Recommended textbooks for you
Exploring Economics
Economics
ISBN:
9781544336329
Author:
Robert L. Sexton
Publisher:
SAGE Publications, Inc


Economics (MindTap Course List)
Economics
ISBN:
9781337617383
Author:
Roger A. Arnold
Publisher:
Cengage Learning
Exploring Economics
Economics
ISBN:
9781544336329
Author:
Robert L. Sexton
Publisher:
SAGE Publications, Inc
Economics (MindTap Course List)
Economics
ISBN:
9781337617383
Author:
Roger A. Arnold
Publisher:
Cengage Learning

Brief Principles of Macroeconomics (MindTap Cours…
Economics
ISBN:
9781337091985
Author:
N. Gregory Mankiw
Publisher:
Cengage Learning

Essentials of Economics (MindTap Course List)
Economics
ISBN:
9781337091992
Author:
N. Gregory Mankiw
Publisher:
Cengage Learning
