Initially, an economy is in long-run equilibrium with a real GDP of $4 trillion. Suppose that increases in marginal tax rates on wages reduce the supply of labor. 1.) Using the line drawing tool, show the effect on the economy. Properly label your new line. 2.) Using the point drawing tool, show the new equilibrium price level and output. Label the point E₂- Carefully follow the instructions above, and only draw the required objects. The situation shown above can be described as OA. secular deflation. OB. demand-side inflation. OC. supply-side inflation. OD. supply-side deflation.
Initially, an economy is in long-run equilibrium with a real GDP of $4 trillion. Suppose that increases in marginal tax rates on wages reduce the supply of labor. 1.) Using the line drawing tool, show the effect on the economy. Properly label your new line. 2.) Using the point drawing tool, show the new equilibrium price level and output. Label the point E₂- Carefully follow the instructions above, and only draw the required objects. The situation shown above can be described as OA. secular deflation. OB. demand-side inflation. OC. supply-side inflation. OD. supply-side deflation.

Chapter20: Aggregate Demand And Supply
Section: Chapter Questions
Problem 8SQP

Related questions
Question
Transcribed Image Text:Initially, an economy is in long-run equilibrium with a real GDP of $4 trillion.
Suppose that increases in marginal tax rates on wages reduce the supply of labor.
1.) Using the line drawing tool, show the effect on the economy. Properly label your new line.
2.) Using the point drawing tool, show the new equilibrium price level and output. Label the point E₂-
Carefully follow the instructions above, and only draw the required objects.
The situation shown above can be described as
OA. secular deflation.
OB. demand-side inflation.
OC. supply-side inflation.
OD. supply-side deflation.
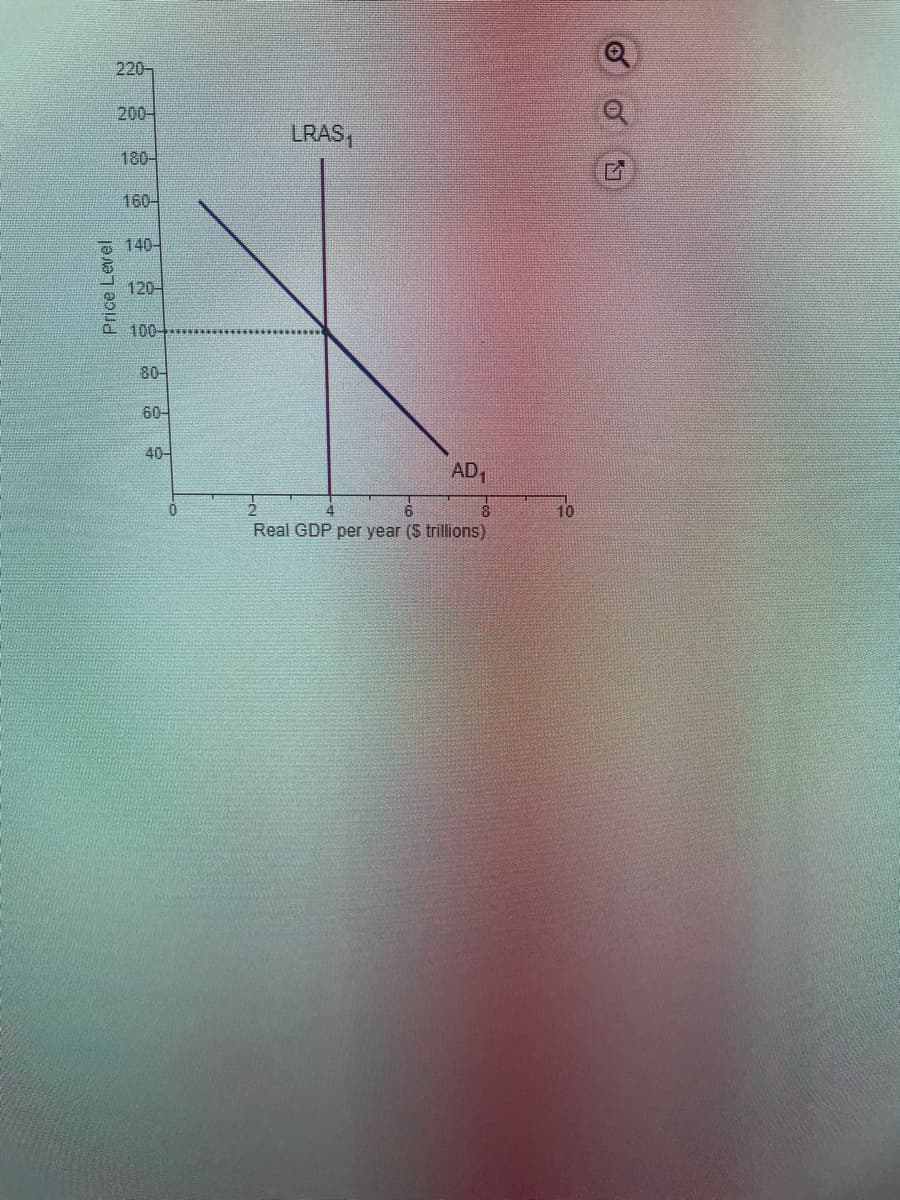
Transcribed Image Text:Price Level
220-
200-
180-
160-
140-
120-
100-
80-
60-
40-
0
LRAS₁
AD₁₁
4
8
Real GDP per year ($ trillions)
10
G
Expert Solution
This question has been solved!
Explore an expertly crafted, step-by-step solution for a thorough understanding of key concepts.

This is a popular solution!

Trending now
This is a popular solution!

Step by step
Solved in 3 steps with 1 images

Knowledge Booster


Learn more about
Need a deep-dive on the concept behind this application? Look no further. Learn more about this topic, economics and related others by exploring similar questions and additional content below.Recommended textbooks for you


Economics (MindTap Course List)
Economics
ISBN:
9781337617383
Author:
Roger A. Arnold
Publisher:
Cengage Learning


Macroeconomics: Private and Public Choice (MindTa…
Economics
ISBN:
9781305506756
Author:
James D. Gwartney, Richard L. Stroup, Russell S. Sobel, David A. Macpherson
Publisher:
Cengage Learning