Inspired by the example about how background music influences choice of entrée at a restaurant, a statistics student decided to investigate other ways to influence a person's behavior. Using 60 volunteers, she randomly assigned 20 volunteers to get a "red" survey, 20 volunteers to get a "blue" survey, and 20 volunteers to get a control survey. The first three questions on each survey were the same, but the fourth and fifth questions were different. For example, the fourth question on the "red" survey was "When you think of the color red, what do you think about?" On the blue survey, the question replaced red with blue. On the control survey, the last two questions were not about color. As a reward, each volunteer was allowed to choose a chocolate candy in a red wrapper or a chocolate candy in a blue wrapper. Here are segmented bar graphs showing the results of the experiment. 100 Red candy Which of the following observations from the 80 Blue candy segmented bar graphs is false? O A higher percentage of those in the red survey 60 group chose the red candy, compared with those who took the blue survey. 40 O Over half of those in the blue survey chose the blue candy. O 60% of those in the control survey chose the red 20 candy. O Over 60% of those who took the red survey chose Red Blue Control survey survey survey the red candy. Type of survey O Those in the control survey were more likely to choose the blue candy, compared with those in the red survey. Percent
Inspired by the example about how background music influences choice of entrée at a restaurant, a statistics student decided to investigate other ways to influence a person's behavior. Using 60 volunteers, she randomly assigned 20 volunteers to get a "red" survey, 20 volunteers to get a "blue" survey, and 20 volunteers to get a control survey. The first three questions on each survey were the same, but the fourth and fifth questions were different. For example, the fourth question on the "red" survey was "When you think of the color red, what do you think about?" On the blue survey, the question replaced red with blue. On the control survey, the last two questions were not about color. As a reward, each volunteer was allowed to choose a chocolate candy in a red wrapper or a chocolate candy in a blue wrapper. Here are segmented bar graphs showing the results of the experiment. 100 Red candy Which of the following observations from the 80 Blue candy segmented bar graphs is false? O A higher percentage of those in the red survey 60 group chose the red candy, compared with those who took the blue survey. 40 O Over half of those in the blue survey chose the blue candy. O 60% of those in the control survey chose the red 20 candy. O Over 60% of those who took the red survey chose Red Blue Control survey survey survey the red candy. Type of survey O Those in the control survey were more likely to choose the blue candy, compared with those in the red survey. Percent

Holt Mcdougal Larson Pre-algebra: Student Edition 2012
1st Edition
ISBN:9780547587776
Author:HOLT MCDOUGAL
Publisher:HOLT MCDOUGAL
Chapter11: Data Analysis And Probability
Section11.5: Interpreting Data
Problem 9E

Related questions
Topic Video
Question
Transcribed Image Text:Resources
O Hint
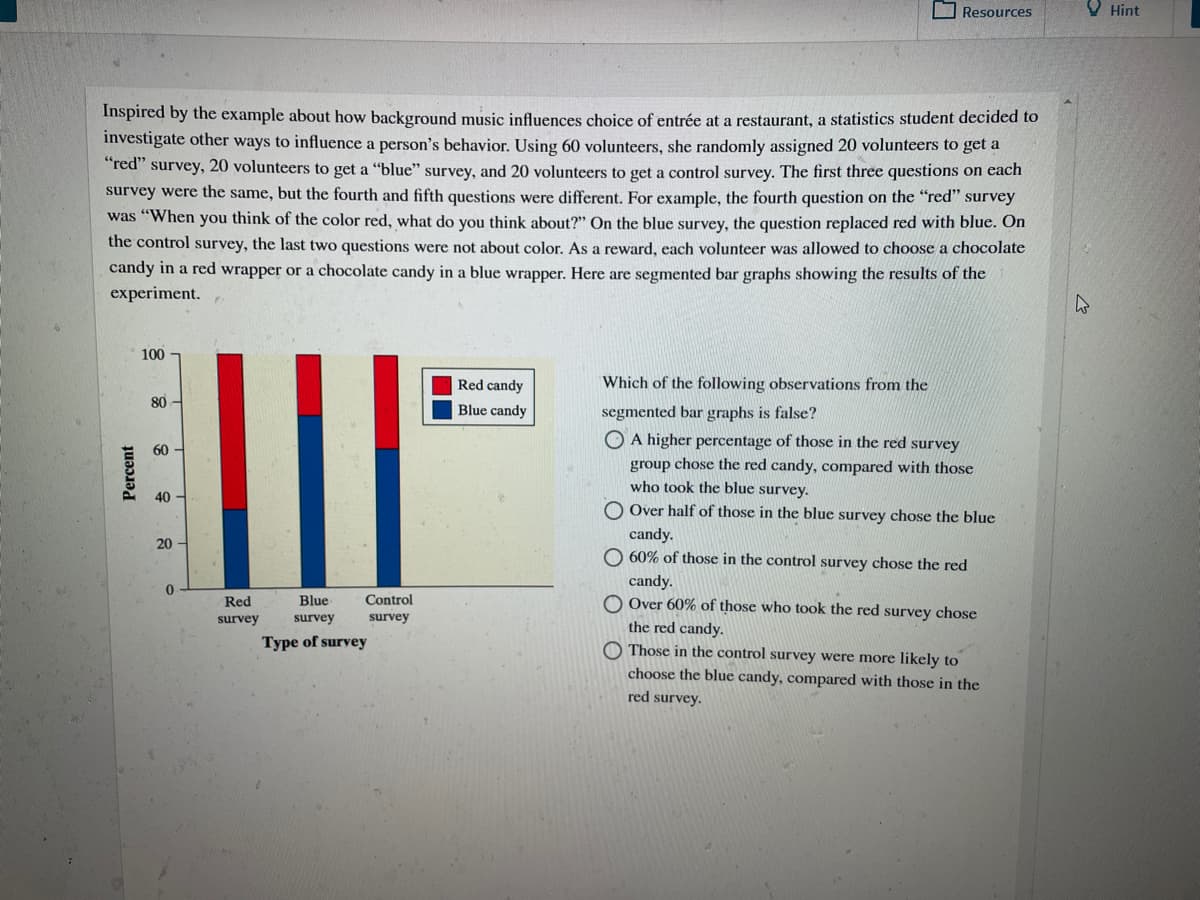
Inspired by the example about how background music influences choice of entrée at a restaurant, a statistics student decided to
investigate other ways to influence a person's behavior. Using 60 volunteers, she randomly assigned 20 volunteers to get a
"red" survey, 20 volunteers to get a "blue" survey, and 20 volunteers to get a control survey. The first three questions on each
survey were the same, but the fourth and fifth questions were different. For example, the fourth question on the "red" survey
was "When you think of the color red, what do you think about?" On the blue survey, the question replaced red with blue. On
the control survey, the last two questions were not about color. As a reward, each volunteer was allowed to choose a chocolate
candy in a red wrapper or a chocolate candy in a blue wrapper. Here are segmented bar graphs showing the results of the
experiment.
100
Red candy
Which of the following observations from the
80
Blue candy
segmented bar graphs is false?
O A higher percentage of those in the red survey
group chose the red candy, compared with those
who took the blue survey.
60
40
O Over half of those in the blue survey chose the blue
candy.
60% of those in the control survey chose the red
20 -
candy.
O Over 60% of those who took the red survey chose
the red candy.
Those in the control survey were more likely to
Red
Blue
Control
survey
survey
survey
Type of survey
choose the blue candy, compared with those in the
red survey.
Percent
Expert Solution
This question has been solved!
Explore an expertly crafted, step-by-step solution for a thorough understanding of key concepts.

This is a popular solution!

Trending now
This is a popular solution!

Step by step
Solved in 2 steps with 1 images

Knowledge Booster


Learn more about
Need a deep-dive on the concept behind this application? Look no further. Learn more about this topic, statistics and related others by exploring similar questions and additional content below.Recommended textbooks for you
Holt Mcdougal Larson Pre-algebra: Student Edition…
Algebra
ISBN:
9780547587776
Author:
HOLT MCDOUGAL
Publisher:
HOLT MCDOUGAL

Glencoe Algebra 1, Student Edition, 9780079039897…
Algebra
ISBN:
9780079039897
Author:
Carter
Publisher:
McGraw Hill

Big Ideas Math A Bridge To Success Algebra 1: Stu…
Algebra
ISBN:
9781680331141
Author:
HOUGHTON MIFFLIN HARCOURT
Publisher:
Houghton Mifflin Harcourt
Holt Mcdougal Larson Pre-algebra: Student Edition…
Algebra
ISBN:
9780547587776
Author:
HOLT MCDOUGAL
Publisher:
HOLT MCDOUGAL
Glencoe Algebra 1, Student Edition, 9780079039897…
Algebra
ISBN:
9780079039897
Author:
Carter
Publisher:
McGraw Hill
Big Ideas Math A Bridge To Success Algebra 1: Stu…
Algebra
ISBN:
9781680331141
Author:
HOUGHTON MIFFLIN HARCOURT
Publisher:
Houghton Mifflin Harcourt