Instructions: please put the data in excel , or at least try to do so. --------- Company Z has the following historical sales information for one of its hydraulic pump models for the last 4 years: (the only image attached (period, years)) --------------------------------------- On the other hand, the manufacturing process used by Company Z is sequential* and has the following characteristics: Machines that can be used in any order** M1 M2 M3 M4 Production rate per machine per hour 7 4.75 4.25 6.50 Machine efficiency % 0.9 0.95 1 0.85 Machine reliability % 0.70 0.95 1 0.80 Sequential; in the sense that the output of Mi is the input of Mi + 1 **In any order; in the sense that they can be interchanged, e.g. MA -> MB or MB -> MA. The company's operating costs are as follows: Cost per final unit produced "free of defects": $100 Cost per final unit produced "with defects". $150 Cost of excess inventory ("defect free" units) $50 Cost per short of inventory (units "free of defects") $200 Revenue per "defect-free" final unit produced and sold $250 The following operating conditions apply: - Any sequence of 3 machines can be used. - Only one machine can be used once, within the same sequence of machines. - You can work UP TO 720 hours per month. - A "level production" type production strategy is followed. Establish the 1st and 2nd best sequence of machines that allows company Z to obtain higher profits (profit = total revenue - total costs) for a hypothetical 5th year, knowing that: 1.- It must round the results of its predicted values, to the next integer value, if and only if, the fractional part is ≥ 0.5. 2.- It must increase in 100 and 800 units (respectively), the predicted values of periods 1 and 3; and decrease in 500 and 250 units (respectively), the predicted values of periods 2 and 4. In both cases PROVE that both sequences meet the requirements of being the 1st and 2nd best sequences.


Instructions:
please put the data in excel , or at least try to do so.
---------
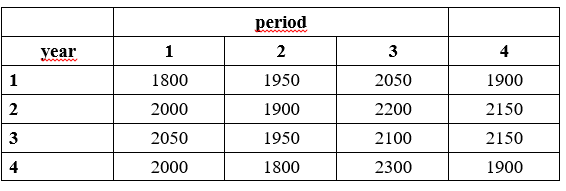
Company Z has the following historical sales information for one of its hydraulic pump models for the last 4 years:
(the only image attached (period, years))
---------------------------------------
On the other hand, the manufacturing process used by Company Z is sequential* and has the following characteristics:
Machines that can be used in any order** M1 M2 M3 M4
Production rate per machine per hour 7 4.75 4.25 6.50
Machine efficiency % 0.9 0.95 1 0.85
Machine reliability % 0.70 0.95 1 0.80
Sequential; in the sense that the output of Mi is the input of Mi + 1
**In any order; in the sense that they can be interchanged, e.g. MA -> MB or MB -> MA.
The company's operating costs are as follows:
Cost per final unit produced "free of defects": $100
Cost per final unit produced "with defects". $150
Cost of excess inventory ("defect free" units) $50
Cost per short of inventory (units "free of defects") $200
Revenue per "defect-free" final unit produced and sold $250
The following operating conditions apply:
- Any sequence of 3 machines can be used.
- Only one machine can be used once, within the same sequence of machines.
- You can work UP TO 720 hours per month.
- A "level production" type production strategy is followed.
Establish the 1st and 2nd best sequence of machines that allows company Z to obtain higher profits (profit = total revenue - total costs) for a hypothetical 5th year, knowing that:
1.- It must round the results of its predicted values, to the next integer value, if and only if, the fractional part is ≥ 0.5.
2.- It must increase in 100 and 800 units (respectively), the predicted values of periods 1 and 3; and decrease in 500 and 250 units (respectively), the predicted values of periods 2 and 4.
In both cases PROVE that both sequences meet the requirements of being the 1st and 2nd best sequences.

Step by step
Solved in 4 steps with 4 images


