intercept the meaning of regression coefficent of independent variable?


Q: Find Multiple Regression Analysis.
A: Given information: X Y X^2 Y^2 XY 0.5 1.5 0.25 2.25 0.75 1.3 4.8 1.69 23.04 6.24 2.4 5.3…
Q: What is the intercept of the regression line?
A: First enter this data into Excel
Q: What is the value of the intercept for the regression equation?
A:
Q: Find the equation of the regression line
A: Lemon Imports (x) : 230,260,365,467,550 Crash Fatality rate(y): 16, 15.9,15.7,15.4,15.1 Total…
Q: Need an example of multiple linear regression
A: Multiple linear regression is where more than one independent value, meaning that we try to predict…
Q: Explain this plot (linear regression analysis
A: Q-Q plot is nothing but quantile plot and is used to check whether the data follows normality. If…
Q: How use simple regression to explore the relationship between two variables?
A: The simple linear equation y=a+bx is used to predict a response for given value of predictor…
Q: at point does the regression line
A: the value of constant = α = 3.413 the constant is the value of the dependent variable when the…
Q: Explain in detail how regression analysis can be used to forecast the demand for a firm’s product or…
A: The literal meaning of word regression means stepping back or going back toward the average.
Q: Describe about the Multiple Regression Equation.
A: Independent and dependent variables in regression: In a simple regression, the variable of interest,…
Q: To estimate the regression equation, the slope is equal to?
A: Here given paired data of x and y By using formula of regression line slope
Q: regression
A: Here it is asked to find the degrees of freedom in a regression model with an intercept term that…
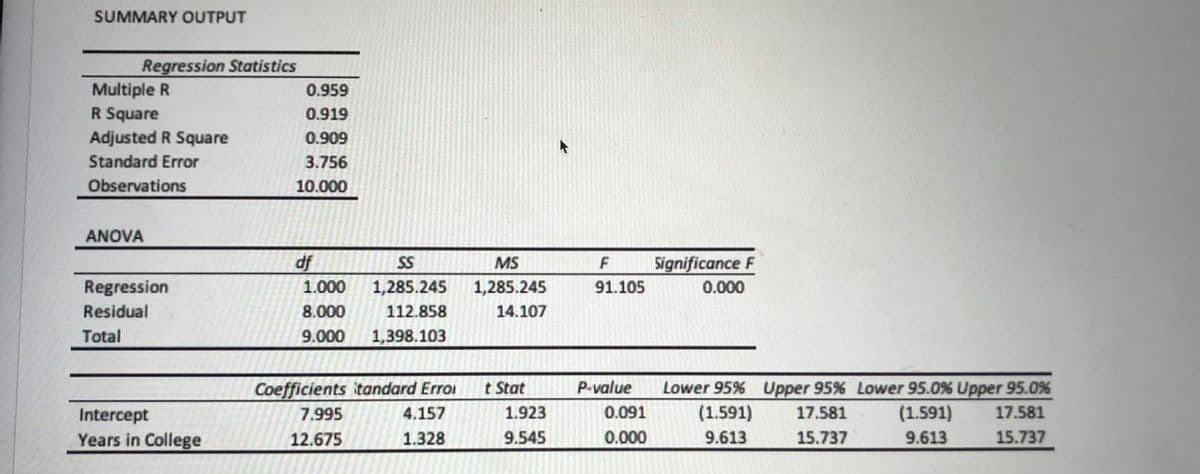
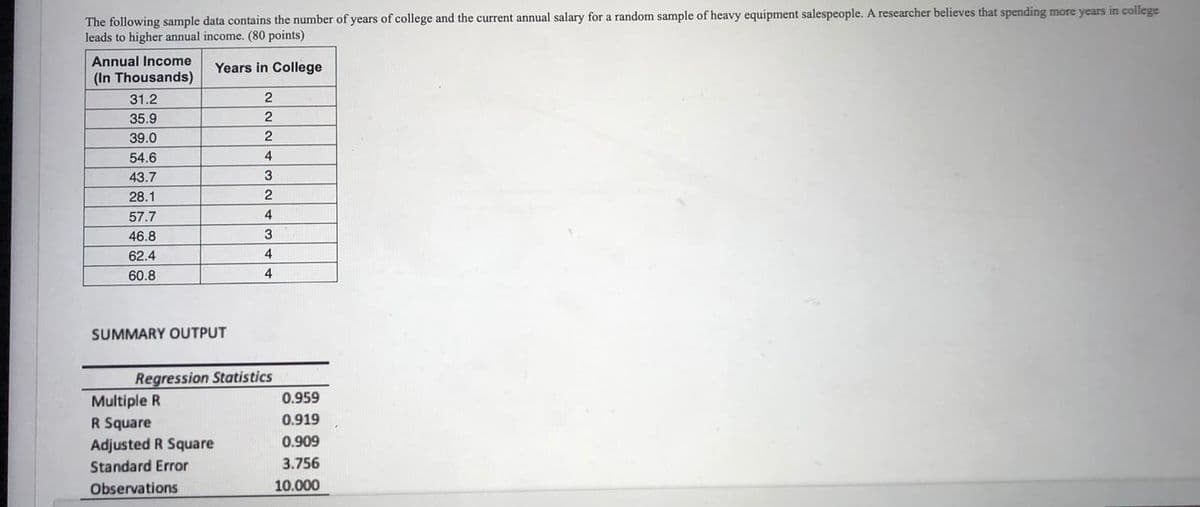
Q: In the picture, there is a summary of regression analysis. Interpret the results in terms of…
A: Regression Analysis: After a regression model is fitted, the model is tested for the goodness of fit…
Q: The regression equation is intended to be the “best fitting” straight line for a set of data. What…
A: There can be many lines that can relate the independent and the dependent variables. But one of the…
Q: Find the intercept of the regression line.
A: here from given Information Sxx = 6000 Syy = 153028 Sxy = -30060
Q: analyze the multiple regression?
A: Multiple regression is an expansion of simple linear regression. It is used to be predicted the…
Q: the regression line to make a prediction
A: Correlation: This is the extent of the relationship between two variables. Regression: It is the…
Q: Write the multiple regression equation for miles per gallon as the response variable. Use weight and…
A: A regression equation models the dependent relationship of two or more variables. It is a measure of…
Q: Explain how simple regression modeling can be extended to understand the relationship among several…
A: Independent and dependent variables in regression: In a simple regression, the variable of interest,…
Q: regression?
A: Housing Values depends on the waste development.
Q: Describe about how to place a regression line?
A: The most common method for placing a regression line is Least squares method. In this method the…
Q: What is the value of the coefficient of determination ? what is the slope of the regression…
A:
Q: Explain the Regression Equations if we have two variables X and Y?
A: Regression analysis: Regression analysis estimates the relationship among variables. That is, it…
Q: help me understand what the coefficient regression table means please (p-value specifically)
A: Regression is used to predict the value of dependent variable by using one or more independent…
Q: (a) Demonstrate the two important things that should be done before one performs regression…
A: Regression analysis examines the relationship between one or more variables. So two things that can…
Q: Give five examples where the use of regression analysis can be beneficially be made.
A: Answer: For the given question,
Q: How can you find the amount of intercept in the regression involving standardized variables
A: Given information: The general linear regression model is given as Y=a+b1·X1+b2·X2.
Q: State the regression identity for degrees of freedom in this case of three predictor variables.
A: The regression identify for degrees of freedom with k predictors and n observations and having total…
Q: What is Multiple Regression Equation?
A: Introduction: Independent and dependent variables in regression: In a simple regression, the…
Q: What is the flowchart of non linear regression? explain.
A:
Q: Develop a multiple regression equation for starting salaries using School Ranking, GPA, and…
A: Given variables are salaries, school _ranking, gpa and experience.
Q: Discuss the usefulness of regression.
A: Regression: It is a statistical method used in finance, investment, or other disciplines attempting…
Q: Explain how the coefficient of multiple determination, R2, is used as a descriptive measure in…
A:
Q: Find the regression equation, letting the first variable be the predictor (x) variable. Using the…
A: The regression equation is, y-cap =53.8+0.2(x)
Q: Interpret the values of the regression coefficients (intercept and slope)in this context. Note…
A: The regression analysis is conducted using EXCEL. The software procedure is given below: Enter the…
Q: What is the independent variable using the table below showing the regression of assets and revenue?
A: Independent variable: The variable which does not influenced by other variables then it is called as…
Q: in multiple regression analysis, a residual is the difference between the value of a dependent…
A: We know that, In any regression model, Residual is the difference between the value of a dependent…
Q: Explain this plot (linear regression analysis)
A: The fitted versus residual plot is useful in checking regression assumptions.
Q: What are the interpretations of the Y intercept and the slopes in a multiple regression model?
A: What are the interpretations of the Y intercept and the slopes in a multiple regression model?
Q: Would the regression in Equation be useful for predicting test scoresin a school district in…
A: Regression is always used for prediction. If we have previous data, we will made a regression…
Q: Explain Instrumental variables regression?
A: An instrumental variable (sometimes referred to as a "instrument" variable) is a third variable, Z,…
Q: How does utilizing linear regression benefit or help a business?
A: Linear regression analysis is a statistical method to find the relationship between two or more…
Q: Describe the concept of Regression toward the Mean.
A: Regression toward the mean: This is the phenomenon that occurs usually when a non-random sample is…
Q: What are some important applications of regression analysis in the real world?
A: 1.)Weather forecast 2.)Financial Risk and growth assessment 3.)Analysis of medical data…
Q: Describe multiple regression?
A: Regression analysis enables the inference or prediction of a variable from one or more other…
Q: True or False Having a linear regression equation allows us to predict a Y' score for any X value?
A: The linear regression equation allows us to predict Y' score for the given range of X values only.…
Q: rpret b1 and b2 in a multiple regressio
A: b1 b2
Q: Explain the roles of tenter and tremove in stepwise regression.
A: Stepwise regression method:Stepwise regression method is a combination of forward selection method…
intercept the meaning of regression coefficent of independent variable?

Step by step
Solved in 2 steps with 1 images

- GreenLawns provides a lawn fertilizer and weed control service. The company is adding a special aeration treatment as a low-cost extra service option, which it hopes will help attract new customers. Management is planning to promote this new service in two media: radio and direct-mail advertising. A media budget of $3,500 is available for this promotional campaign. Based on past experience in promoting its other services, GreenLawns obtained the following estimate of the relationship between sales and the amount spent on promotion in these two media. S = −2R2 − 10M2 − 8RM + 18R + 34M where S = total sales in thousands of dollars R = thousands of dollars spent on radio advertising M = thousands of dollars spent on direct-mail advertising. GreenLawns would like to develop a promotional strategy that will lead to maximum sales subject to the restriction provided by the media budget. (a) What is the value of sales (in dollars) if $2,500 is spent on radio advertising and $1,000 is…The Bureau of Labor Statistics gathers data about employment in the United States. A sample is taken to calculate the number of U.S. citizens working in one of several industry sectors over time. Table 11.16 shows the results: Industry Sector 2000 2010 2020 TotalNonagriculture wage and salary 13,243 13,044 15,018 41,305Goods-producing, excluding agriculture 2,457 1,771 1,950 6,178Services-providing 10,786 11,273 13,068 35,127Agriculture, forestry, fishing, and hunting 240 214 201 655Nonagriculture self-employed and unpaid family worker 931 894 972 2,797Secondary wage and salary jobs in agriculture and private householdindustries 14 11 11 36Secondary jobs as a self-employed or unpaid family worker 196 144 152 492Total 27,867 27,351 31,372 86,590 Table 11.16 We want to know if the change in the number of jobs is independent of the change in years. State the null and alternative hypotheses and the degrees of freedom.Food deserts have become a particularly hot topic in the public health community as an explanation for a variety of negative health outcomes in disadvantaged areas. A researcher is interested in comparing the average shelf space provided by supermarkets, convenience stores, and corner stores in two different communities in order to address the growing concern for food deserts. Assume the following table reports the summary statistics for shelf space dedicated to fresh fruits and vegetables (meters) from SRSs of a variety of different stores that supply groceries from each community. Community Average shelf space for fresh fruits and vegetables (m) Sample standard deviation Sample size "Food desert" 13.7 2.4 12 Other community 89.4 14.6 14 A) Carry out the appropriate statistical test in order to determine if there is a significantdifference in mean shelf space between the two communities at the alpha level of 0.05. Assumeall conditions for the test are met. Do not assume…
- Several methods of estimating the number of seeds in soil samples have been developed by ecologists. An article gave the accompanying data on the number of seeds detected by the direct method and by the stratified method for 27 soil specimens. Specimen Direct Stratified 1 23 8 2 34 39 3 0 8 4 60 59 5 20 54 6 63 63 7 40 28 8 8 8 9 14 8 10 94 100 11 3 0 12 68 59 13 79 68 14 23 54 Specimen Direct Stratified 15 34 28 16 0 0 17 39 39 18 19 14 19 94 94 20 3 14 21 40 48 22 23 23 23 0 0 24 8 14 25 14 40 26 19 14 27 40 79 Do the data provide sufficient evidence to conclude that the mean number of seeds detected differs for the two methods? Test the relevant hypotheses using ? = 0.05. (Use ?direct − ?stratified.) Find the test statistic. (Round your answer to two decimal places.) t = Find the df. (Round your answer down to the nearest whole number.) df = Use technology to find the P-value. (Round your answer to four…23.Food deserts have become a particularly hot topic in the public health community as an explanation for a variety of negative health outcomes in disadvantaged areas. A researcher is interested in comparing the average shelf space provided by supermarkets, convenience stores, and corner stores in two different communities in order to address the growing concern for food deserts. Assume the following table reports the summary statistics for shelf space dedicated to fresh fruits and vegetables (meters) from SRSs of a variety of different stores that supply groceries from each community. Community Average shelf space for fresh fruits and vegetables (m) Sample standard deviation Sample size "Food desert" 13.7 2.4 12 Other community 89.4 14.6 14 23.Food deserts have become a particularly hot topic in the public health community as an explanation for a variety of negative health outcomes in disadvantaged areas. A researcher is interested in comparing the average shelf space…Chest Injury Rating Car Driver Passenger Car Driver Passenger 1 42 35 10 36 37 2 42 35 11 36 37 3 34 45 12 43 58 4 34 45 13 40 42 5 45 45 14 43 58 6 40 42 15 37 41 7 42 46 16 37 41 8 43 58 17 44 57 9 45 43 18 42 42 Generate test results (α = .01) using data analysis (EXCEL).
- 2. In the article “Case Adaptation Method of CaseBased Reasoning for Construction Cost Estimation in Korea” (J. Constr. Engr. Mgmt., 2012: 43–52) provided data on military barrack projects undertaken by the Korean Ministry of National Defense from 2004 to 2008. Two variables of interest were the floor area of a barrack and the corresponding cost (in $US). The corresponding data is given in the attached image: a. Construct stem and leaf displays of both floor area and cost. Explain it.b. Do the values of cost appear to be perfectly linearly related to the floor area values? c. Construct a scatterplot of the data. Does it appear that cost could be accurately predicted by the value of floor area? Explain reasoning.In a manufacturing plant a work center is a specific production facility that consists of one or more people and or machines and is treated as one unit for the purposes of capacity requirements for planning and job scheduling. If jobs arrive at a work center faster than they depart the work center impedes overall productions and is referred to as a bottleneck. The data below was collected by a plant manager for use in investigating a potential bottleneck work center. Construct a histogram for each data set. Do your histograms suggest that the work center may be a bottleneck? Explain. Number of Items Arriving at Work Center per Hour: 155 115 156 150 159 163 172 143 159 166 148 175 151 161 138 148 129 135 140 152 139 Number of Items Departing Work Center per Hour: 156 109 127 148 135 119 140 127 115 122 99 106 171 123 135 125 107 152 111 137 1612.Tuition Fees: The following table shows the average annual tuition and fees at private andpublic 4-year colleges and universities for the school years 2009-2010 through 2014-2015. Year Private Public2009-2010 31,448 15,0142010-2011 32,617 15,9182011-2012 33,674 16,8052012-2013 35,074 17,4742013-2014 36,193 18,3722014-2015 37,385 19,203a. Using 1 for 2009-2010, 2 for 2010-2011, and so on, find the linear correlationcoefficient and the equation of the least-squares line for the tuition and fees at private 4-year colleges and universities, based on the year. Don Honorio Ventura State University Pasig, Candaba, Pampanga MMW103: Mathematics in the Modern Worldb. Using 1 for 2009-2010, 2 for 2010-2011, and so on, find the linear correlationcoefficient and the equation of the least-squares line for the tuition and fees at public 4-year colleges and universities, based on the year.c. Based on the linear correlation coefficients you found in parts a and b, are theequations you wrote in parts…
- Location Basel Basel Basel lat 47.546944 47.546944 47.546944 lon 7.568918 7.568918 7.568918 asl 283.69672 283.69672 283.69672 variable Wind Speed Wind Speed Wind Speed unit km/h km/h km/h level 10 m 10 m 10 m resolution daily daily daily aggregation Maximum Minimum Mean timestamp Basel Wind Speed [10 m] Basel Wind Speed [10 m] Basel Wind Speed [10 m] 2022-12-20T00:00:00 18.681883 5.7599998 11.791341 2022-12-21T00:00:00 35.652725 3.2399998 16.304209 2022-12-22T00:00:00 37.11319 18.079027 26.106277 2022-12-23T00:00:00 37.57993 15.379206 27.482597 2022-12-24T00:00:00 23.157824 5.3999996 12.934727 2022-12-25T00:00:00 15.807239 7.289445 12.189437 2022-12-26T00:00:00 24.923338 3.8773184 13.438794 2022-12-27T00:00:00 23.664352 0.35999998 6.766806 2022-12-28T00:00:00 16.75064 0.35999998 10.514861 2022-12-29T00:00:00 26.009842 7.2 17.154203 For your data, use the linear forecasting model which is y = mx + c to calculate and discuss the followings:…apply visual and descriptive analytics to summarize the data for italy. Use this to draw any initial conclusion date total_cases new_cases total_deaths new_deaths 12/31/2019 0 0 0 0 1/1/2020 0 0 0 0 1/2/2020 0 0 0 0 1/3/2020 0 0 0 0 1/4/2020 0 0 0 0 1/5/2020 0 0 0 0 1/6/2020 0 0 0 0 1/7/2020 0 0 0 0 1/8/2020 0 0 0 0 1/9/2020 0 0 0 0 1/10/2020 0 0 0 0 1/11/2020 0 0 0 0 1/12/2020 0 0 0 0 1/13/2020 0 0 0 0 1/14/2020 0 0 0 0 1/15/2020 0 0 0 0 1/16/2020 0 0 0 0 1/17/2020 0 0 0 0 1/18/2020 0 0 0 0 1/19/2020 0 0 0 0 1/20/2020 0 0 0 0 1/21/2020 0 0 0 0 1/22/2020 0 0 0 0 1/23/2020 0 0 0 0 1/24/2020 0 0 0 0 1/25/2020 0 0 0 0 1/26/2020 0 0 0 0 1/27/2020 0 0 0 0 1/28/2020 0 0 0 0 1/29/2020 0 0 0 0 1/30/2020 0 0 0 0 1/31/2020 3 3 0 0 2/1/2020 3 0 0 0 2/2/2020 3 0 0 0 2/3/2020 3 0 0 0 2/4/2020 3 0 0 0 2/5/2020 3 0 0 0 2/6/2020 3 0 0 0 2/7/2020 3 0 0 0 2/8/2020 3 0 0 0 2/9/2020 3 0 0 0 2/10/2020 3 0 0 0 2/11/2020…A statistics professor would like to build a model relating student scores on the first test to the scores on the second test. The test scores from a random sample of 2121 students who have previously taken the course are given in the table. Test Scores Student First Test Grade Second Test Grade 1 8989 7777 2 6060 7373 3 5252 6767 4 4444 6262 5 7474 7373 6 6969 7171 7 4343 6363 8 8080 7878 9 4747 6161 10 7676 7878 11 6565 7575 12 8989 7878 13 7878 7777 14 9696 8181 15 5252 6161 16 9393 8585 17 9090 8080 18 6767 6969 19 4343 6060 20 4848 6161 21 4646 6161 Copy Data Step 1 of 2: Using statistical software, estimate the parameters of the model Second Test Grade=β0+β1(First Test Grade)+εiSecond Test Grade=β0+β1(First Test Grade)+εi. Enter a negative estimate as a negative number in the regression model. Round your answers to 4 decimal places, if necessary.
