Interpret the findings of this study.

MATLAB: An Introduction with Applications
6th Edition
ISBN:9781119256830
Author:Amos Gilat
Publisher:Amos Gilat
Chapter1: Starting With Matlab
Section: Chapter Questions
Problem 1P

Related questions
Question
Interpret the findings of this study.
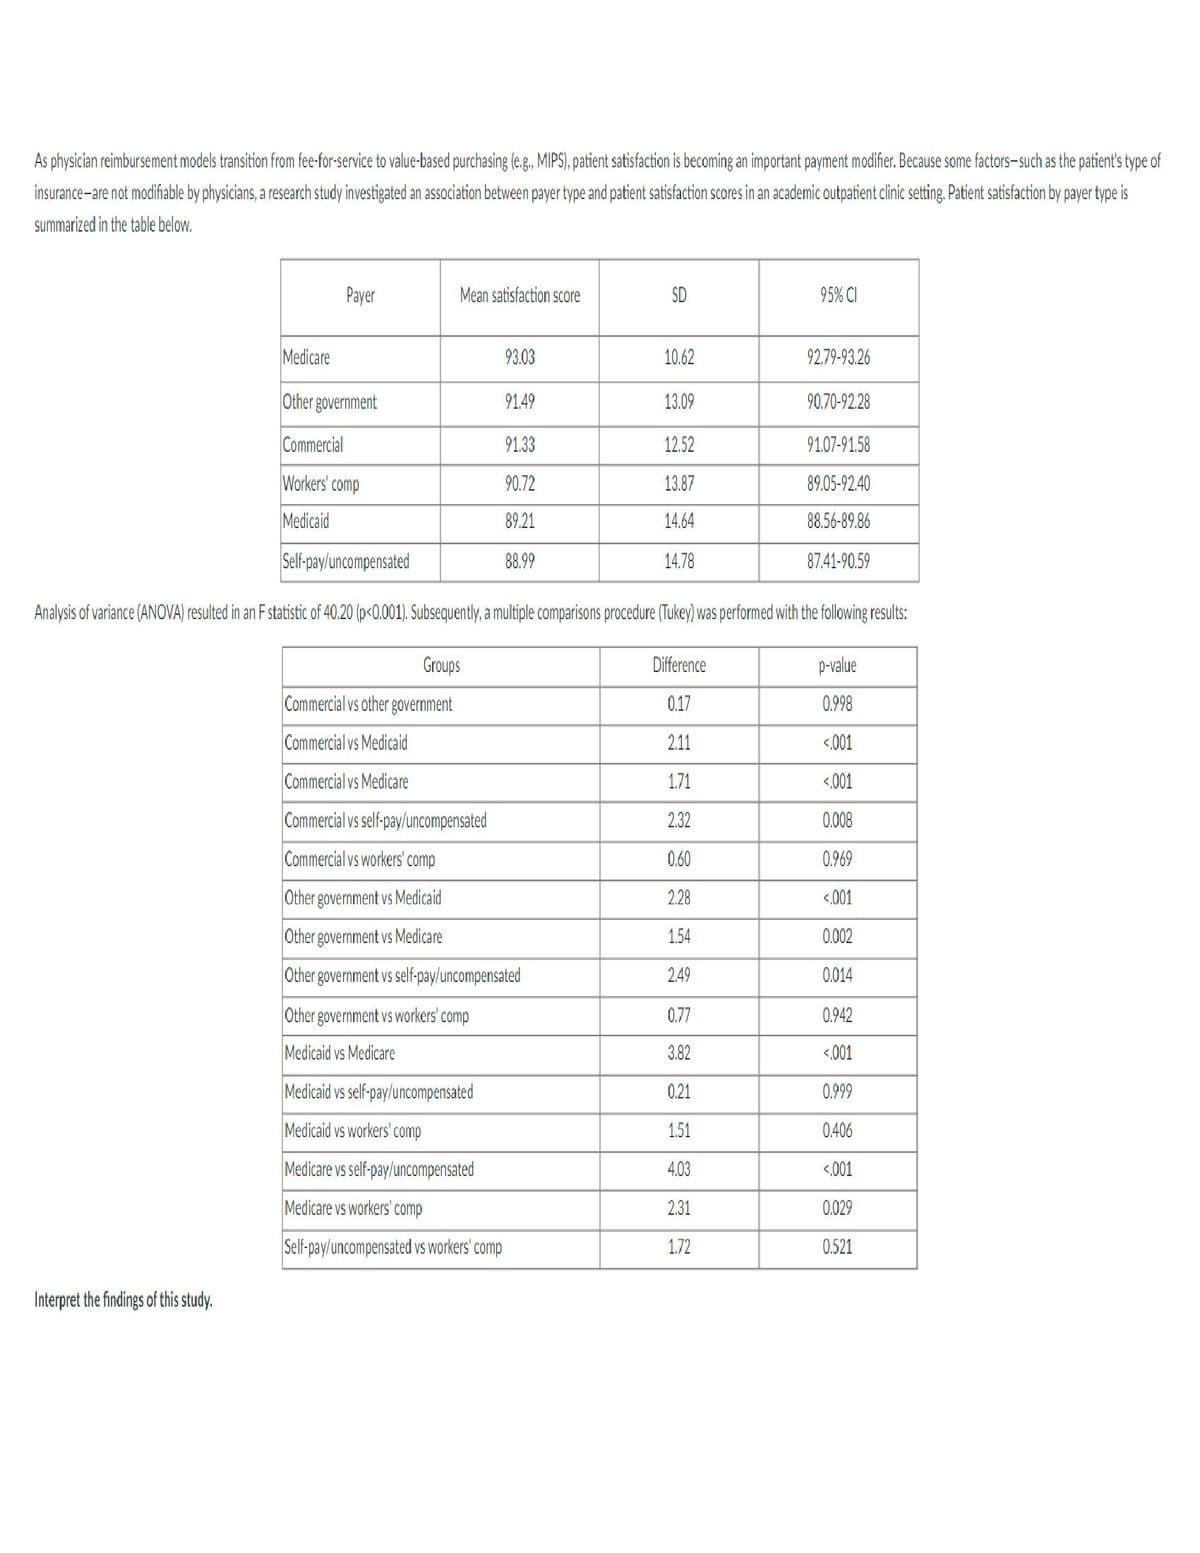
Transcribed Image Text:As physician reimbursement models transition from fee-for-service to value-based purchasing (e.g., MIPS), patient satisfaction is becoming an important payment modifier. Because some factors-such as the patient's type of
insurance-are not modifiable by physicians, a research study investigated an association between payer type and patient satisfaction scores in an academic outpatient clinic setting. Patient satisfaction by payer type is
summarized in the table below.
Medicare
Interpret the findings of this study.
Payer
Other government
Commercial
Workers' comp
Medicaid
Mean satisfaction score
Medicare vs
Medicare vs workers' comp
Self-pay/uncompensated vs workers' comp
self-pay/uncompensated
93.03
91.49
91.33
90.72
89.21
88.99
SD
10.62
13.09
12.52
13.87
14.64
14.78
Self-pay/uncompensated
Analysis of variance (ANOVA) resulted in an F statistic of 40.20 (p<0.001). Subsequently, a multiple comparisons procedure (Tukey) was performed with the following results:
Groups
p-value
Commercial vs other government
0.998
Commercial vs Medicaid
<.001
Commercial vs Medicare
<.001
Commercial vs self-pay/uncompensated
0.008
Commercial vs workers' comp
0.969
Other government vs Medicaid
<.001
Other government vs Medicare
0.002
Other government vs self-pay/uncompensated
0.014
Other government vs workers' comp
0.942
Medicaid vs Medicare
<.001
Medicaid vs self-pay/uncompensated
0.999
Medicaid vs workers' comp
0.406
<.001
0.029
0.521
95% CI
Difference
0.17
2.11
1.71
2.32
0.60
2.28
1.54
2.49
0.77
3.82
0.21
1.51
4.03
2.31
1.72
92.79-93.26
90.70-92.28
91.07-91.58
89.05-92.40
88.56-89.86
87.41-90.59
Expert Solution
This question has been solved!
Explore an expertly crafted, step-by-step solution for a thorough understanding of key concepts.

Step by step
Solved in 3 steps

Recommended textbooks for you
MATLAB: An Introduction with Applications
Statistics
ISBN:
9781119256830
Author:
Amos Gilat
Publisher:
John Wiley & Sons Inc

Probability and Statistics for Engineering and th…
Statistics
ISBN:
9781305251809
Author:
Jay L. Devore
Publisher:
Cengage Learning

Statistics for The Behavioral Sciences (MindTap C…
Statistics
ISBN:
9781305504912
Author:
Frederick J Gravetter, Larry B. Wallnau
Publisher:
Cengage Learning
MATLAB: An Introduction with Applications
Statistics
ISBN:
9781119256830
Author:
Amos Gilat
Publisher:
John Wiley & Sons Inc
Probability and Statistics for Engineering and th…
Statistics
ISBN:
9781305251809
Author:
Jay L. Devore
Publisher:
Cengage Learning
Statistics for The Behavioral Sciences (MindTap C…
Statistics
ISBN:
9781305504912
Author:
Frederick J Gravetter, Larry B. Wallnau
Publisher:
Cengage Learning

Elementary Statistics: Picturing the World (7th E…
Statistics
ISBN:
9780134683416
Author:
Ron Larson, Betsy Farber
Publisher:
PEARSON

The Basic Practice of Statistics
Statistics
ISBN:
9781319042578
Author:
David S. Moore, William I. Notz, Michael A. Fligner
Publisher:
W. H. Freeman

Introduction to the Practice of Statistics
Statistics
ISBN:
9781319013387
Author:
David S. Moore, George P. McCabe, Bruce A. Craig
Publisher:
W. H. Freeman