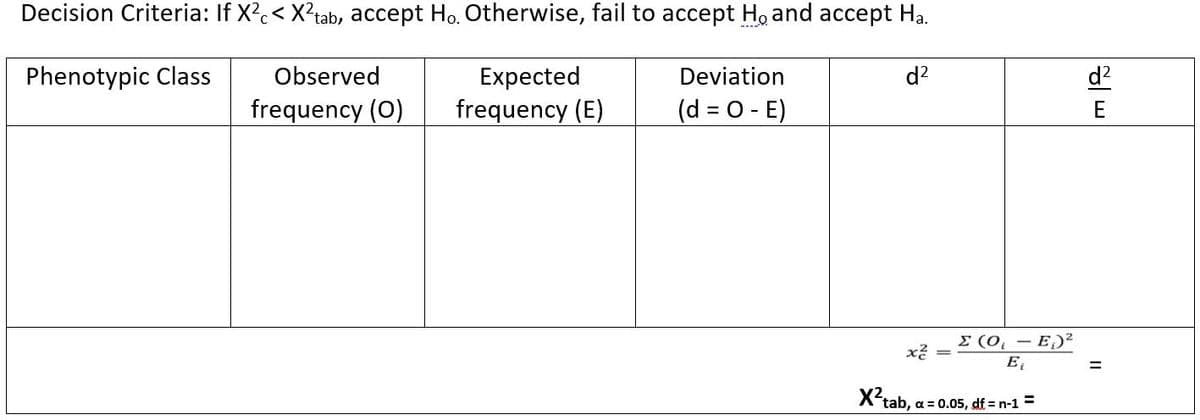
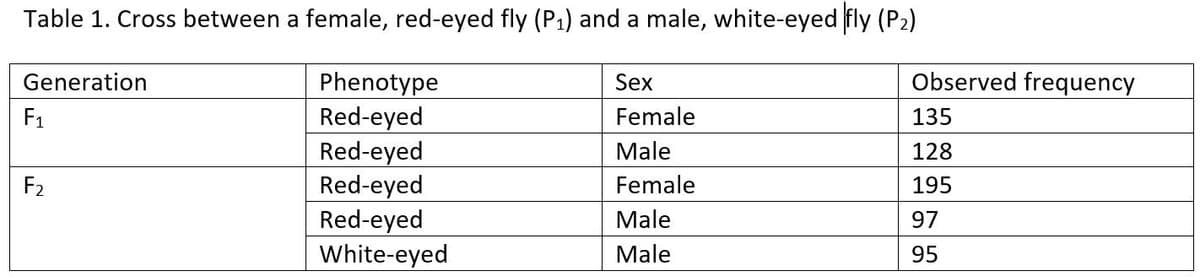
Using the data on the segregation of eye-color from Dosophila culture (see table 1). Tabulate your F1 and F2 data on eye-color as associated with sex by making a table. Based on your observations, frame your hypothesis as to the expected segregation of eye-color associated with sex. Apply the Chi-squared test to determine the goodness of fit of your data per generation. Ho: Ha: Decision Criteria: If X2c < X2tab, accept Ho. Otherwise, fail to accept Ho and accept Ha. Fill-up the next table. Conclusion:


Using the data on the segregation of eye-color from Dosophila culture (see table 1).
Tabulate your F1 and F2 data on eye-color as associated with sex by making a table.
Based on your observations, frame your hypothesis as to the expected segregation of eye-color associated with sex. Apply the Chi-squared test to determine the goodness of fit of your data per generation.
Ho:
Ha:
Decision Criteria: If X2c < X2tab, accept Ho. Otherwise, fail to accept Ho and accept Ha. Fill-up the next table.
Conclusion:

Step by step
Solved in 3 steps with 2 images

Interpret the result of your Chi-squared test. How many gene pairs were responsible for eye color in flies as associated with sex? What gene interaction was present in the gene/s for eye color? What is the genotype of the possible P1 & P2 that produced this F2 population? (Remember to indicate your gene notation).

