interpret the slope. for each additional color consumed per week, bone material density will (increase, decrease) by ( ) g/cm squared, on average.
interpret the slope. for each additional color consumed per week, bone material density will (increase, decrease) by ( ) g/cm squared, on average.

Linear Algebra: A Modern Introduction
4th Edition
ISBN:9781285463247
Author:David Poole
Publisher:David Poole
Chapter7: Distance And Approximation
Section7.3: Least Squares Approximation
Problem 31EQ

Related questions

Question
100%
10/15
interpret the slope.
for each additional color consumed per week, bone material density will (increase, decrease) by ( ) g/cm squared, on average.
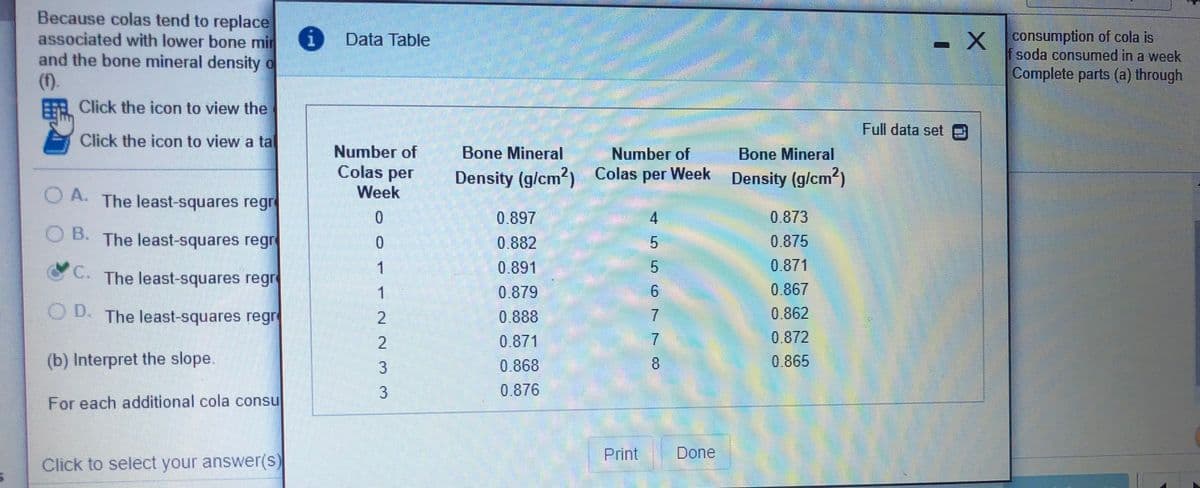
Transcribed Image Text:Because colas tend to replace
associated with lower bone min
and the bone mineral density o
(f).
R Click the icon to view the
-X consumption of cola is
f soda consumed in a week
Data Table
Complete parts (a) through
Full data set
Click the icon to view a ta
Number of
Bone Mineral
Number of
Bone Mineral
Colas per
Density (g/cm) Colas per Week Density (g/cm2)
O A. The least-squares regr
Week
0.897
4
0.873
B. The least-squares regr
0.875
0.
0.882
C.
1.
0.871
0.891
The least-squares regr
1
0.879
6.
0.867
O D. The least-squares regr
0.862
0.872
7.
0.888
0.871
2.
7.
(b) Interpret the slope.
0.868
8.
0.865
0.876
For each additional cola consul
Print
Done
Click to select your answer(s)
333
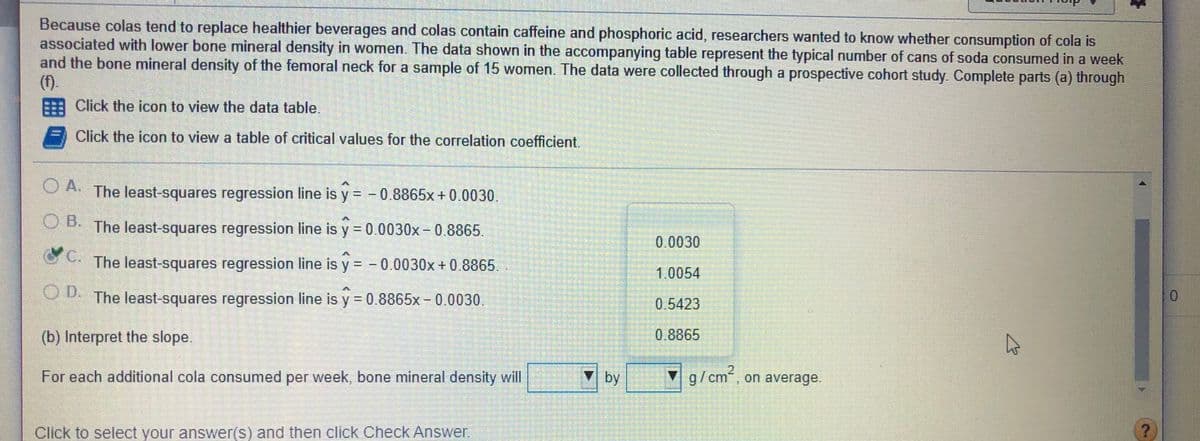
Transcribed Image Text:Because colas tend to replace healthier beverages and colas contain caffeine and phosphoric acid, researchers wanted to know whether consumption of cola is
associated with lower bone mineral density in women. The data shown in the accompanying table represent the typical number of cans of soda consumed in a week
and the bone mineral density of the femoral neck for a sample of 15 women. The data were collected through a prospective cohort study. Complete parts (a) through
(f).
EE Click the icon to view the data table.
Click the icon to view a table of critical values for the correlation coefficient.
CA. The least-squares regression line is y = - 0.8865x + 0.0030.
OA.
%3D
O B.
The least-squares regression line is y = 0.0030x-0.8865.
0.0030
The least-squares regression line is y = - 0.0030x+ 0.8865.
%3D
1.0054
OD.
The least-squares regression line is y = 0.8865x- 0.0030,
0.
%3D
0.5423
(b) Interpret the slope.
0.8865
For each additional cola consumed per week, bone mineral density will
by
▼ g/cm, on average.
Click to select your answer(s) and then click Check Answer.
Expert Solution
This question has been solved!
Explore an expertly crafted, step-by-step solution for a thorough understanding of key concepts.

Step by step
Solved in 2 steps

Knowledge Booster


Learn more about
Need a deep-dive on the concept behind this application? Look no further. Learn more about this topic, statistics and related others by exploring similar questions and additional content below.Recommended textbooks for you
Linear Algebra: A Modern Introduction
Algebra
ISBN:
9781285463247
Author:
David Poole
Publisher:
Cengage Learning

Glencoe Algebra 1, Student Edition, 9780079039897…
Algebra
ISBN:
9780079039897
Author:
Carter
Publisher:
McGraw Hill
Linear Algebra: A Modern Introduction
Algebra
ISBN:
9781285463247
Author:
David Poole
Publisher:
Cengage Learning
Glencoe Algebra 1, Student Edition, 9780079039897…
Algebra
ISBN:
9780079039897
Author:
Carter
Publisher:
McGraw Hill