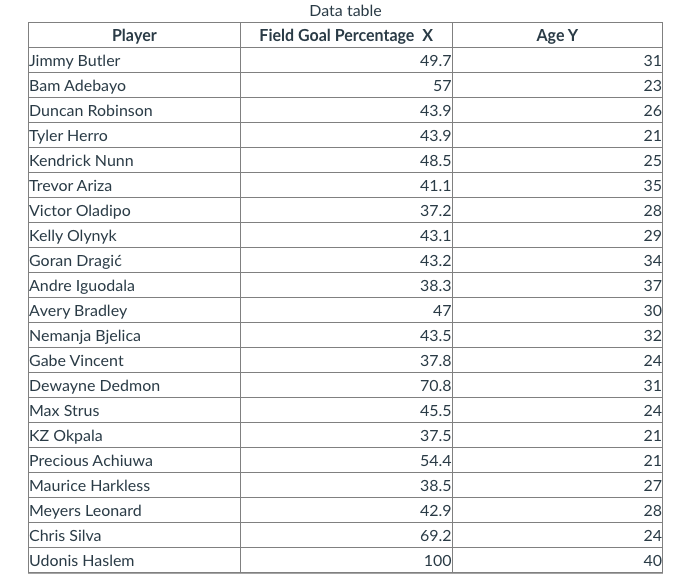
Interpret this correlation coefficient. What does this mean for the relationship between age and field goal percentage? Do players seem to make more shots or fewer shots as they get older? Was the claim that older players are more accurate correct? why or why not?


Q: Suppose that the random variable X is continuous and takes its values uniformly over the interval…
A: Given that X~U(a,b) a=0 , b=2
Q: A random sample of 300 circuits generated 13 defectives. Use the data to test the hypothesis Ho: P =…
A: Givensample size(n)=300x=13The null and alternative hypothesis isH0:p=0.05H1:p≠0.05significance…
Q: what is the p value
A: The value of the chi-square test statistic is, 12.09 The degree of freedom is,
Q: Table below shows advertisement investment and the sales volume of different brands of Soda Media…
A: Given data: Media Expense (M) Sales Volume 150 2000 90 1400 60 800 55…
Q: Find out some merits and demerits of seasonal variation? Find out some merits and demerits of…
A: Since you have asked multiple questions, we will solve the first question for you. If you want any…
Q: The heights of German men are normally distributed with a mean of 65.9 inches and a standard…
A: a) Assume a random variable X defines the heights of German men.
Q: An unfair die looks like an ordinary six-sided die but the outcomes are not equally likely. The…
A: Given: The probability distribution of the face value is: xi 1 2 3 4 5 6 Total P(X=xi) 0.15…
Q: The table below shows the distribution of the masses of 100 adults measured to the nearest kilogram.…
A: Given data is Mass(kg) 50-59 60-69 70-79 80-89 90-99 100-109 Frequency(f) 5 9 28 33 17 8
Q: The number of chocolate chips in an 18-ounce bag of chocolate chip cookies is approximately normally…
A: As per our guidelines, I can solve only first 3 subparts. Kindly post the remaining subpart again…
Q: at do you think the distribution of each of the following data sets will look like? Be sure to…
A: Here we want to know distribution from the given information.
Q: Frequency 6.2 6.25 6.3 6.35 PH 6.4 (a) Describe the shape of the distribution. 6.45 6.5 6.55 O The…
A: From the given histogram we want to know correct statement.
Q: It will take exactly four seconds to verify the debit card. ): In how much time would you expect the…
A: Given Number of lanes used initially=1 Arrival rate=750 per hour Service rate =1 car in 4 second
Q: A biologist measures the stem length of plants. The following data was obtained. Length (cm) x…
A: Given data is Length(x) Frequency(f) 25 3 26 9 27 10 28 12 29 20 30 19 31 14 32…
Q: EXCEL FORMULA?
A: lot conforming nonconforming A 88 12 B…
Q: Suppose that in any given time period a certain stock is equally likely to go up 11 unit or down 1…
A: Xi : The amount the stock goes up in the i-th time period. So, Xi is Random Variable. Now, given…
Q: A probability experiment consists of rolling a 6-sided die. Find the probability of the event below.…
A: event is rolling a 6 sided die. then sample space(S); S={1,2,3,4,5,6}, n(S) = 6 Let event E:…
Q: The Masters Golf Tournament is played each year at the Augusta National Golf Club in Augusta,…
A: Frequency is the number of times an observation happen. It is also known as count of an observation.…
Q: An assembly line produces USB keys. The probability that each of the keys produced has some type of…
A: Given that X~negative binomial (r) r=97 P=1- 0.036 =0.964
Q: Below displays the sample sizes and percentages of people in different age and gender groups who…
A: Introduction: It is required to identify the correct option.
Q: The Gambers falalcy is 1.The knowledge that the probability of a particular event actually does…
A: Gambers falalcy : Event occurred more frequently than expected in past, Then , it has less…
Q: K Assume the resting heart rates for a sample of individuals are normally distributed with a mean of…
A:
Q: Z Scores -1.5 0.52 -1.0 1.7 3.0 1. Calculate the raw skewness and kurtosis scores for these data .…
A: Since you have asked posted a question with multiple sub-parts, we will solve the first three…
Q: 2. Suppose that S(y)/S(0), y ≥ 0, is a lognormal random variable with parameters μ = 0.01y and…
A: Given that SyS0, y≥0 is a lognormal distribution with parameters μ=0.01y and σ=0.2y.
Q: Forty-two percent of runaways in the United Stated are male. If 20 runaways are selected at random,…
A: Givenp=42%=0.42sample size(n)=20x~Binomial(n=20,p=0.42)P(X=x)=(nx)×px×(1-p)n-x ; x=0,1,...,n
Q: The IQ scores for a random sample of subjects with low lead levels in their blood and another random…
A: (b) Obtain the 95% confidence interval for the difference between two population means. The 95%…
Q: At a back-to-school party, one of your friends lets you play a two-stage game where you pay $3 to…
A: Given Information: You pay $3 to play the game. A fair coin is flipped, noting the side shown and a…
Q: 5 cards are drawn at random from a standard deck. Find the probability that all the cards are…
A: Solution-: 5 cards are drawn at random from a standard deck. We want to find (a) P(All the cards…
Q: grocery store has 6 self-checkout stations. The probability distribution of the number of utilized…
A: Given that Probability distribution function. Xi 1 2 3 4 5 6 Total P(X=xi) 0.12 0.15 0.42 0.2…
Q: Gabrielle has purchased the 2-year extended warranty from a retailer to cover the value of hers new…
A: Given: 2-year extended warranty price=$25 cellphone price =$1400 probability that it gets damaged or…
Q: 1. A Statistics class reports the following data on Sex and Eye Color for students in the class:…
A: Given that Blue=B Brown=Br Green/Hazel/Other=G Total Males=M 8 20 6 34 Females=F 4 16 12…
Q: Suppose that you have eight cards. Five are green and three are yellow. The cards are well shuffled.…
A: given data 5 green cards 3 yellow cards ________________ 8 total cards draw 2 cards at random one…
Q: Suppose Z follows the standard normal distribution. Calculate the following probabilities using the…
A:
Q: The time required for an automotive center to complete an oil change service on an automobile…
A: (a) The values given in the question are as follows, Mean (µ) = 15, and Standard deviation (σ) = 4…
Q: The resting heart rate of a classmate in beats per minute is what type of variable? Group of answer…
A: Solution: The variables could be classified into two types 1) Qualitative (Categorical) variable…
Q: The number of chocolate chips in an 18-ounce bag of Chips Ahoy! chocolate chip cookies is…
A: Let X represents the number of chocolate chips in a bag. X~N(1262, 118) Here mean = 1262, standard…
Q: Twenty-four fast-food restaurant hourly employees were surveyed to see how many hours they worked…
A: x=41.625
Q: You must estimate the mean temperature (in degrees Fahrenheit) with the following sample…
A: Given data is 19.6,31,45.6,21,40.4,27.1,20.1,41.8,54.4sample size(n)=9confidence level=98%
Q: a) What size sample is needed if we desire a power of 0.95?
A: Given the data of fasting blood sugar levels for 52 women during their third trimester of pregnancy.…
Q: The data shows the number of car thefts in a city for a period of 20 days.…
A:
Q: year, controls, 18.44 Year-to-year comparison. Rather than comparing the two groups in each we could…
A: Given information: tControl=0.63tSupplemented=-2.63
Q: Find the: A. Mean B. Median C. Mode,
A: Given data: Classes Frequency 13 - 18 4 19 - 24 6 25 - 30 8 31 - 36 3 37 - 42 4 43 -…
Q: The mango is considered the "king of fruits" in many parts of the world. Mangoes are generally…
A:
Q: 2 (5) The dotplot below is a sampling distribution of sample proportions from random samples of size…
A: Given information: n=200p^=0.199S.E(n=200)=0.028
Q: The table below shows the number of male and female students enrolled in nursing at a particular…
A:
Q: A researcher wants to know how long it takes, on average, for a certain species of bacteria to…
A: Given data,n=21σ=0.6CI=0.99α=1-0.99=0.01
Q: Consider the linear model E(Y) = XB and Var(Y) = o²I. We assume that the n x p' matrix X has a…
A: As we know that the estimated value of regression parameters holds following properties 1. Best…
Q: A tennis ball machine fires balls a distance that is approximately normally distributed. The mean…
A: Let X: A tennis ball machine fires balls a distance.X has approximately normally distributed.…
Q: The graph illustrates a normal distribution for the prices paid for a particular model of HD…
A: Since you have posted a question with multiple sub-parts, we will solve first three subparts for…
Q: reonna has purchased the life insurance policy for her fish for the price of $100 per year and…
A: Given: Insurance policy price=$100 If fishes passes away company has to give=$4000 probability of…
Q: a. To compute the confidence interval use a distribution. b. With 95% confidence the…
A: Given that Sample size = 255 , Mean = 2.2 , Sample Standard deviation = 2.9
Interpret this


Trending now
This is a popular solution!

Step by step
Solved in 2 steps

- Cholesterol Cholesterol in human blood is necessary, but too much can lead to health problems. There are three main types of cholesterol: HDL (high-density lipoproteins), LDL (low-density lipoproteins), and VLDL (very low-density lipoproteins). HDL is considered “good” cholesterol; LDL and VLDL are considered “bad” cholesterol. A standard fasting cholesterol blood test measures total cholesterol, HDL cholesterol, and triglycerides. These numbers are used to estimate LDL and VLDL, which are difficult to measure directly. Your doctor recommends that your combined LDL/VLDL cholesterol level be less than 130 milligrams per deciliter, your HDL cholesterol level be at least 60 milligrams per deciliter, and your total cholesterol level be no more than 200 milligrams per deciliter. (a) Write a system of linear inequalities for the recommended cholesterol levels. Let x represent the HDL cholesterol level, and let y represent the combined LDL VLDL cholesterol level. (b) Graph the system of inequalities from part (a). Label any vertices of the solution region. (c) Is the following set of cholesterol levels within the recommendations? Explain. LDL/VLDL: 120 milligrams per deciliter HDL: 90 milligrams per deciliter Total: 210 milligrams per deciliter (d) Give an example of cholesterol levels in which the LDL/VLDL cholesterol level is too high but the HDL cholesterol level is acceptable. (e) Another recommendation is that the ratio of total cholesterol to HDL cholesterol be less than 4 (that is, less than 4 to 1). Identify a point in the solution region from part (b) that meets this recommendation, and explain why it meets the recommendation.Is it possible that P(AB)=P(A)? Explain.The average number of minutes Americans commute to work is 27.7 minutes (Sterling’s BestPlaces, April 13, 2012). The average commute time in minutes for 48 cities are as follows:Albuquerque 23.3 Jacksonville 26.2 Phoenix 28.3Atlanta 28.3 Kansas City 23.4 Pittsburgh 25.0Austin 24.6 Las vegas 28.4 Portland 26.4Baltimore 32.1 Little Rock 20.1 Providence 23.6Boston 31.7 Los Angeles 32.2 Richmond 23.4Charlotte 25.8 Louisville 21.4 Sacramento 25.8Chicago 38.1 Memphis 23.8 Salt Lake City 20.2Cincinnati 24.9 Miami 30.7 San Antonio 26.1Cleveland 26.8 Milwaukee 24.8 San Diego 24.8Columbus 23.4 Minneapolis 23.6 San Francisco 32.6Dallas 28.5 Nashville 25.3 San Jose 28.5Denver 28.1 New Orleans 31.7 Seattle 27.3Detroit 29.3 New York 43.8 St. Louis 26.8el Paso 24.4 Oklahoma City 22.0 Tucson 24.0Fresno 23.0 Orlando 27.1 Tulsa 20.1indianapolis 24.8 Philadelphia 34.2 Washington, D.C. 32.8a. What is the mean commute time for these 48 cities?b. Compute the median commute time
- The average number of minutes Americans commute to work is 27.7 minutes (Sterling’s BestPlaces, April 13, 2012). The average commute time in minutes for 48 cities are as follows:Albuquerque 23.3 Jacksonville 26.2 Phoenix 28.3Atlanta 28.3 Kansas City 23.4 Pittsburgh 25.0Austin 24.6 Las vegas 28.4 Portland 26.4Baltimore 32.1 Little Rock 20.1 Providence 23.6Boston 31.7 Los Angeles 32.2 Richmond 23.4Charlotte 25.8 Louisville 21.4 Sacramento 25.8Chicago 38.1 Memphis 23.8 Salt Lake City 20.2Cincinnati 24.9 Miami 30.7 San Antonio 26.1Cleveland 26.8 Milwaukee 24.8 San Diego 24.8Columbus 23.4 Minneapolis 23.6 San Francisco 32.6Dallas 28.5 Nashville 25.3 San Jose 28.5Denver 28.1 New Orleans 31.7 Seattle 27.3Detroit 29.3 New York 43.8 St. Louis 26.8el Paso 24.4 Oklahoma City 22.0 Tucson 24.0Fresno 23.0 Orlando 27.1 Tulsa 20.1indianapolis 24.8 Philadelphia 34.2 Washington, D.C. 32.8a. What is the mean commute time for these 48 cities?b. Compute the median commute time.c. Compute the mode.d.…The average number of minutes Americans commute to work is 27.7 minutes (Sterling’s BestPlaces, April 13, 2012). The average commute time in minutes for 48 cities are as follows:Albuquerque 23.3 Jacksonville 26.2 Phoenix 28.3Atlanta 28.3 Kansas City 23.4 Pittsburgh 25.0Austin 24.6 Las vegas 28.4 Portland 26.4Baltimore 32.1 Little Rock 20.1 Providence 23.6Boston 31.7 Los Angeles 32.2 Richmond 23.4Charlotte 25.8 Louisville 21.4 Sacramento 25.8Chicago 38.1 Memphis 23.8 Salt Lake City 20.2Cincinnati 24.9 Miami 30.7 San Antonio 26.1Cleveland 26.8 Milwaukee 24.8 San Diego 24.8Columbus 23.4 Minneapolis 23.6 San Francisco 32.6Dallas 28.5 Nashville 25.3 San Jose 28.5Denver 28.1 New Orleans 31.7 Seattle 27.3Detroit 29.3 New York 43.8 St. Louis 26.8el Paso 24.4 Oklahoma City 22.0 Tucson 24.0Fresno 23.0 Orlando 27.1 Tulsa 20.1indianapolis 24.8 Philadelphia 34.2 Washington, D.C. 32.8a. What is the mean commute time for these 48 cities?b. Compute the median commute time.c. Compute the mode.The average number of minutes Americans commute to work is 27.7 minutes (Sterling’s BestPlaces, April 13, 2012). The average commute time in minutes for 48 cities are as follows:Albuquerque 23.3 Jacksonville 26.2 Phoenix 28.3Atlanta 28.3 Kansas City 23.4 Pittsburgh 25.0Austin 24.6 Las vegas 28.4 Portland 26.4Baltimore 32.1 Little Rock 20.1 Providence 23.6Boston 31.7 Los Angeles 32.2 Richmond 23.4Charlotte 25.8 Louisville 21.4 Sacramento 25.8Chicago 38.1 Memphis 23.8 Salt Lake City 20.2Cincinnati 24.9 Miami 30.7 San Antonio 26.1Cleveland 26.8 Milwaukee 24.8 San Diego 24.8Columbus 23.4 Minneapolis 23.6 San Francisco 32.6Dallas 28.5 Nashville 25.3 San Jose 28.5Denver 28.1 New Orleans 31.7 Seattle 27.3Detroit 29.3 New York 43.8 St. Louis 26.8el Paso 24.4 Oklahoma City 22.0 Tucson 24.0Fresno 23.0 Orlando 27.1 Tulsa 20.1indianapolis 24.8 Philadelphia 34.2 Washington, D.C. 32.8a. What is the mean commute time for these 48 cities?
- The average number of minutes Americans commute to work is 27.7 minutes (Sterling’s BestPlaces, April 13, 2012). The average commute time in minutes for 48 cities are as follows:Albuquerque 23.3 Jacksonville 26.2 Phoenix 28.3Atlanta 28.3 Kansas City 23.4 Pittsburgh 25.0Austin 24.6 Las vegas 28.4 Portland 26.4Baltimore 32.1 Little Rock 20.1 Providence 23.6Boston 31.7 Los Angeles 32.2 Richmond 23.4Charlotte 25.8 Louisville 21.4 Sacramento 25.8Chicago 38.1 Memphis 23.8 Salt Lake City 20.2Cincinnati 24.9 Miami 30.7 San Antonio 26.1Cleveland 26.8 Milwaukee 24.8 San Diego 24.8Columbus 23.4 Minneapolis 23.6 San Francisco 32.6Dallas 28.5 Nashville 25.3 San Jose 28.5Denver 28.1 New Orleans 31.7 Seattle 27.3Detroit 29.3 New York 43.8 St. Louis 26.8el Paso 24.4 Oklahoma City 22.0 Tucson 24.0Fresno 23.0 Orlando 27.1 Tulsa 20.1indianapolis 24.8 Philadelphia 34.2 Washington, D.C. 32.8a. What is the mean commute time for these 48 cities?b. Compute the third quartileNakalinzi country farms, a large modern farming corporation in Wakiso, plants cornand wheat on a large tract of irrigated land for a contract to produce Mwana Mugimuporridge for the UNICEF aided world children. Corn requires a special soil that isscarce, and only 500 acres are available for this crop. Wheat can be plantedanywhere on Nakalinzi Country farm’s land. Because of the drought, the regionalwater district office will allow Nakalinzi Country farm's to pump 800 acre-feet of waterfor this season’s plantings. Each acre of corn requires 0.75 acre-foot of water, andeach acre of wheat requires 0.5 acre foot of water for the season. How many acresshould Nakalinzi Country farm's plant in corn and wheat, considering these shortages,if the estimated profit per acre is $400 for corn and $250 for wheat? Use Linearprogramming both graphical and simultaneously to solve this problemDietcolawasonsalelastweek;itcost$10forevery4packsofdietcola. a.Howmuchdo2packsofdietcolacost? b.Howmuchdoes1packofdietcolacost? ExploratoryChallenge a.TeaganwenttoGamerRealmtobuynewvideogames.GamerRealmwashavingasale:$65for4video games.Hebought3gamesforhimselfandonegameforhisfriend,Diego,butTeagandoesnotknowhow muchDiegooweshimfortheonegame.Whatistheunitpriceofthevideogames?Whatistherateunit? ©2015GreatMinds.eureka-math.org G6-M1-SE-1.3.0-06.2015 10 = 10 4 = 5 5 x 2 = 10 10 = 1 4 2 2 x 10 = 20 20 / 4 = $5 4 1 x 10 = 10 10 / 4 = $2.50 10 4 = $2.5 $2.5 x 1 = $2.5 5 $2.5 $65 / 4 = $16.25 65 4 = 1 $16.25 6•1 Lesson16 NYSCOMMONCOREMATHEMATICSCURRICULUM Lesson16: FromRatiostoRates S.70…
- For each of the 32 National Football League teams, the numbers of points scored and allowed during the 2018 season are shown below. Team Wins Points Scored Points Allowed Team Wins PointsScored Points Allowed New York Jets 4 333 441 Chicago Bears 12 421 283 Cleveland Browns 7 359 392 Philadelphia Eagles 9 367 348 Denver Broncos 6 329 349 Tennessee Titans 9 310 303 Jacksonville Jaguars 5 245 316 Kansas City Chiefs 12 565 421 Minnesota Vikings 8 360 341 Baltimore Ravens 10 389 287 Oakland Raiders 4 290 467 Houston Texans 11 402 316 Cincinnati Bengals 6 368 455 Buffalo Bills 6 269 374 Washington Redskins 7 281 359 New Orleans Saints 13 504 353 Los Angeles Rams 13 527 384 Detroit Lions 6 324 360 Tampa Bay Buccaneers 5 396 464 Seattle Seahawks 10 428 347 Miami Dolphins 7 319 433 Indianapolis Colts 10 433 344 Pittsburgh Steelers 9 428 360 San Francisco 49ers 4 342 435 Green Bay Packers 6 376 400 Dallas Cowboys 10 339 324 New…A fast-food restaurant compiled the following information regarding its employees.20 cooked or worked the drive-through window. 10 cooked only6 worked drive-through window onlyHow many of the employees cooked and worked drive-through window ?Player First Round Final Round Michael Letzig 74 72 Scott Verplank 71 75 D.A. Points 69 71 Jerry Kelly 71 72 Soren Hansen 68 72 D.J. Trahan 66 72 Bubba Watson 72 69 Reteif Goosen 74 70 Jeff Klauk 71 70 Kenny Perry 69 70 Aron Price 73 66 Charles Howell 69 66 Jason Dufner 65 65 Mike Weir 69 65 Carl Pettersson 70 77 Bo Van Pelt 67 76 Ernie Els 71 76 Cameron Beckman 77 69 Nick Watney 69 74 Tommy Armour III 77 73
