Interret the estimated slope in the context of the data. (attached) b. report the R2 value, and interpret the value in the context of the data. (attached)
Q: a) Make a scatter plot and draw a best-fit line. Provide the equation. To draw a best-fit line:…
A: Given data: Amount Recycled Amount of Garbage 120 200 144 175 160 190 175 156 200 142…
Q: USE THE ABOVE INFORMATION TO ANSWER THE QUESTIONS BELOW: (Express your answer as decimal and…
A:
Q: A survey was conducted to study the smoking habits of US residents. Below is a data matrix…
A: From the given data it is clearly seen that 'grossincome' contains, under$400000,$40,000 to…
Q: Cappelli Inc. designs and manufactures women's apparel using material from various mills. Their…
A: Given that: Sample size, n=10 Success probability, p=0.36
Q: Given the following information: My confidence intervals: 90% confidence interval = (2.33, 2.56),…
A: In statistics, confidence interval is the range in which one can be confident regarding a population…
Q: 1. In a normal distribution like the one above, which one of the following is true? a. The mean,…
A: It is given that the bell-shaped and symmetric curve of the Normal distribution.
Q: Bashir has $420 to spend at a bicycle store for some new gear and biking outfits. Assume all prices…
A: Given data : The total amount is 420 dollars Price of bicycle = 215.52 dollars Price of…
Q: The following is a 7 by 2 Frequency Distribution Table concerning the systolic blood pressure of…
A: Given that 7 by 2 Frequency Distribution Table concerning the systolic blood pressure of women.
Q: Find the mean, median, mode, range, variance and standard deviation of the following sample data and…
A: As per our guidelines we are supposed to answer only 3 sub-parts of any questions so i am solving…
Q: Test the claim that the proportion of people who own dogs is less than 33%. A random sample of 1000…
A: given data claim : p<0.33 n = 1000 p^ = 0.278 α = 0.01 test statistic(Z) = ?
Q: Use e the 1.5x IQR rule to find the lower and upper limits for determining suspected outliers.…
A: Given: The 5th percentile is 0.81. The 10th percentile is 0.99. The 25th percentile is 1.35. The…
Q: The table below presents the prices, quantities, and relative price index for 2020 for three types…
A: Given data:
Q: What is the point estimate from this sample?
A: Given that 95% confidence interval for the true mean weight of the candy bars is 0.994 to 0.998…
Q: The number of people killed in each state from passenger vehicle crashes for a specific year is…
A: As per our guidelines we are suppose to answer only three subpartskindly post the remaining subparts…
Q: Given independent random variables with means and standard deviations as shown, find the mean and…
A: As per the Bartleby guildlines we have to solve first question and rest can be reposted.... Given…
Q: The results of a mathematics placement exam at two different campuses of Mercy College follow. What…
A: The question is hypo. testing Given : Sample size of campus 1 ( n1 ) = 300 Sample mean of of campus…
Q: 1. The number of gallons of ice cream ordered at JJ Ice Cream on a hot summer day has the following…
A:
Q: 1 2 3 4 5 6 7 8 X(x.) - N= The x₁ 7.2 7.3 7.2 7.1 7.1 7.2 7.1 7.2 (x₁ - x) Σ(x,-x, N rel. 0₂ D (x₁ -…
A: The mean and standard deviation of the data set can be computed as follows: Mean:Symbolic formula:…
Q: The Gallup Poll asked a random sample of 1785 adults if they attended church during the past week.…
A: given data n = 1785 p^ = proportion of people in the sample who attended church. p = 0.40 we have to…
Q: Why not use z-test for approximate normal distribution that n>30?
A: We have given thatMean(µ) = 67300Sample size (n) = 36Sample mean (x̅) = 6500Standard deviations (s)…
Q: 1. Let X₁ and X₂ be independent random variables with mean u and variance o². Suppose that we have…
A:
Q: The data represents the daily rainfall (in inches) for one month. Construct a frequency distribution…
A: We have given daily rainfall (in inches) for one month as follows, 0.35 0 0 0.21 0 0.48 0 0.15…
Q: (i) μ = (1,1)T and Σ = 12 μ = 0 and Σ = 212 2 (iii) μ = 0 and 2 = (3 9) 0 -
A: (a) (i) The Bayes classifier for this case would be a straight line that separates the two normal…
Q: A certain company makes three grades (A, B, and C) of a particular electrical component.…
A:
Q: A consumer watchdog group estimates the mean weight of 1-ounce fun size candy bars to see if…
A: Given information 95% CI for population mean μ is (0.994,0.998) n=sample size=40
Q: Acme Shoes marked up a pair of shoes from the $43.00 cost to $75.00. To the nearest 0.01%, what is…
A: We have given that Mark up price = $43.00 Cost price = $75.00
Q: A random sample of n1 = 258 people who live in a city were selected and 74 identified as a "dog…
A: given data n1 =258 x1 = 74p^1 = x1n1 = 74258 = 0.2868 n2 = 102 x2 = 63 p^2 = x2n2 = 63102 =…
Q: a) Produce a 95% confidence interval (such as between 1000 and 2000) for the true molar mass of the…
A: Data are given on molar mass having five observations. Confidence level (C) = 0.95 To find the 95%…
Q: The lengths of adult males' hands are normally distributed with mean 189 mm and standard deviation…
A: The question is about sampling dist. Given : Popl. mean length of adults males' hands ( μ ) = 189 mm…
Q: 1) A bowl contains 6 berries, 2 are red, one is green, and the remaining is black in color. a) If 2…
A: The probability is the ratio of favorable outcomes of the event to the total number of outcomes. d)…
Q: Socks in a drawer. In your sock drawer you have 4 blue, 5 gray, and 3 black socks. Half asleep one…
A: 4 blue 5 gray 3 black ________________ 12 total socks select 2 at random
Q: in an effort to inform political leaders and economists discussing the deregulation of electric and…
A: Given information: A dendrogram is given. A tree-like diagram known as a dendrogram, records the…
Q: levels might have different effects on males and females, so wants to make sure both are equally…
A: The response variable in this study is exam performance of student
Q: Which branch of statistics allows us to use samples to make generalizations about the populations…
A: The objective is to identify the branch of statistics that allows us to use samples to make…
Q: U.S. Bureau of Labor Statistics current population survey of unemployment rate and median weekly…
A: Data table: Highest Degree Earned Unemployment Rate (%) Median Weekly Earnings ($) Doctoral…
Q: determined the number of days after complete vaccination that antibodies appeared. The following are…
A: Solution: Given information: n=15 Sample size x=19.06667 Sample mean s=6.7344 Sample standard…
Q: answer was 4.19 10^10. Which I am not under
A: N were large The weight of the configuration {n0,n1,n2,...} w = N!n0!n1!n2!...
Q: The average annual rainfall at Amman airport station is 271 mm and the standard deviation is 94 mm.…
A: It is given that Mean, μ = 271 Standard deviation, σ = 94 Standardized precipitation index, SPI = (…
Q: a. What is the formula for the estimated regression line in this scatter plot (attached). b. based…
A: a. The output of a regression analysis is given.
Q: Sketch the scatter plot using the table of bivariate data below. Describe the association between…
A: The data table provided in the question is as follows : x y 8 5 2 8 6 4 3 5 8 6 4 4…
Q: Given: A political campaign is interested in whether city 1 has less support for raising the minimum…
A: Let P1 and P2 are the true proportions for city1 and city2. The null and alternative hypotheses are…
Q: F, that it is ormally tea, A 3104). 1700 According to the model, what proportion of people have a…
A:
Q: A Statistics instructor is analyzing last term’s first test scores from their 75 student course…
A: Given information: A random sample of 15 exam scores is given.
Q: a. Find the probability that at least one household is tuned to 60 Minutes. b. Find the probability…
A: Let X be the random variable that the number of households is tuned to 60 minutes. Here X ~ bin(n =…
Q: Determine the mean and standard deviation of the variable X in each of the following binomial…
A: NOTE:As per my policy i can only answer a, b and c. kindly repost the remaining question. Given that…
Q: A study was conducted to find out whether people who majored in business studies did study foreign…
A:
Q: A survey of 260 young professionals found that one-fifth of them use their cell phones primarily for…
A: From the provided information, Sample size (n) = 260 From which one-fifth of them use their cell…
Q: a sock drawer contains eight navy blue socks and five black socks with no other socks. If you reach…
A:
Q: An online retailer operates two independent warehouses (A & B) where it keeps its inventory. Each…
A: Solution: given that Each warehouse has a .05 probability of experiencing a fire. If a fire is…
Q: 9. Temperature Frequency Relative Frequency 70 - 74 3 3/61= 0.0492 75 - 79 16 16/61= 0.2623 80 - 84…
A: The question is about frequency distribution Given : To find : Value of mean
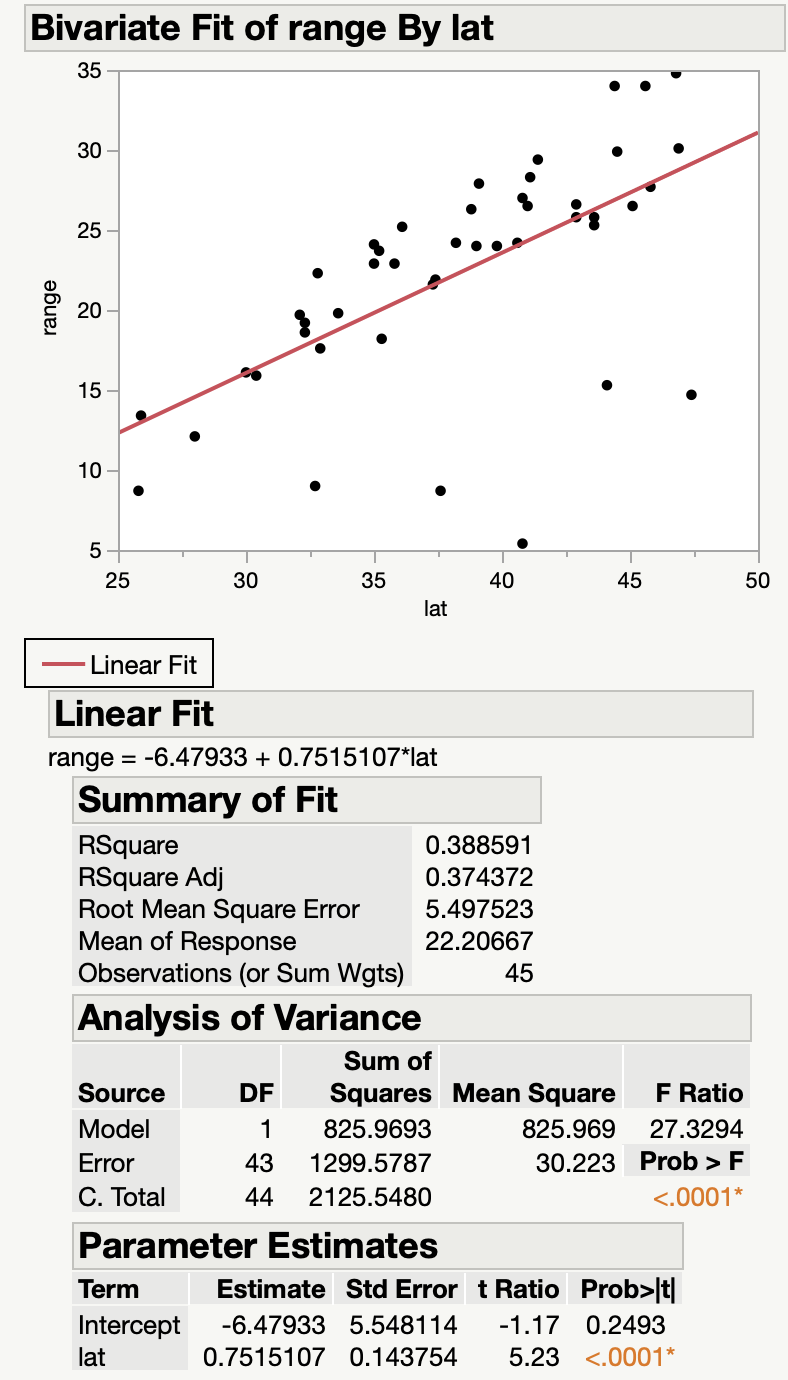
a. Interret the estimated slope in the context of the data. (attached)
b. report the R2 value, and interpret the value in the context of the data. (attached)
Trending now
This is a popular solution!
Step by step
Solved in 2 steps
- Home Runs Two random samples of professional baseball players were selected and the number of home runs hit were recorded. One sample was obtained from the National League, and the other sample was obtained from the American League. At =α0.05, is there a difference in the means? Use the critical value method with tables. Use μ1 for the mean number of home runs from the National League. Assume the variables are normally distributed and the variances are unequal. State the hypotheses and identify the claim with the correct hypothesis. H0: Claim or not a claim H1: Claim or not a claim Is this Hypothesis test a one-tailed or two-tailed test? Find the Critical Value(s): round to 3 decimal places Compute the test value: round to 3 decimal places z= Make the decision Summarize the results National League8 2 9 26 5 6 8American League11 18 13 1225 4 24 9Home Runs Two random samples of professional baseball players were selected and the number of home runs hit were recorded. One sample was obtained from the National League, and the other sample was obtained from the American League. At =α0.05, is there a difference in the means? Use the critical value method with tables. Use μ1 for the mean number of home runs from the National League. Assume the variables are normally distributed and the variances are unequal. State the hypotheses and identify the claim with the correct hypothesis. H0: Claim or not a claim H1: Claim or not a claim Is this Hypothesis test a one-tailed or two-tailed test? Find the Critical Value(s): round to 3 decimal places Compute the test value: round to 3 decimal places z= Make the decision Summarize the results National League American League 8 2 9 2 11 18 3 12 6 5 6 8 25 4 24 9The diameter of steel rods manufactured on two different extrusion machines is being investigated. Two random samples of sizes n1 = 15 and n2 = 17 are selected, and the sample means and sample variances are x1 = 8.73, (s1)^2 = 0.35, x2 = 8.68, and (s2)^2 = 0.40. Assume that the population variances are equal and that the data are drawn from a normal distribution. Construct a 95% CI for the difference in mean rod diameter. Interpret this interval.
- Central Limit Theorem with Means supose a batch of metal shafts produced in a manufacturing company have a variance of 6.25 and a mean diameter of 206 inches. If 90 shafts are sampled at random from the batch, what is the probability that the mean diameter of the sample shafts would differ from the population mean by less than 0.3 inches? Round your answer to four decimal places.Because sample variances are computed by dividing SS by n – 1, the average value of the sample variances from all possible random samples consistently _____ the population variance. underestimate overestimate equal Impossible to determine Which statement below is consistent with computing a weighted average of two individual samples? A computed weighted average will always be closer to the mean average of the larger sample than the mean average of the smaller sample. A computed weighted average will always be closer to the mean average of the smaller sample than the mean average of the larger sample. A weighted average will always equal the average of the two individual sample means. This cannot be determined from the information provided.The test statistic used to test the overall significance of a multiple regression model, the null hypothesis that each one the β-coefficients of the x-variables in the model is equal to zero, is tested against the alternative hypothesis that at least one the β-coefficients of the x-variables in the model is ≠ zero, is the __________. χ2 statistic F value calculated as mean square regression divided by mean square error t statistic F value from the F-distribution tables
- One researcher is comparing scores from two treatment groups using independent samples t test. He would like to know whether the assumption of homogeneity of variance is met. Please first explain what is homogeneity of variance. Then conduct the Hartley’s F-max test to examine this assumption (each group has 6 participants, s2 in group 1 is 20, and s2 in group 2 is 15, set alpha level at .05). Finally, based on the result of the Hartley’s F-max test, how should this researcher estimate the standard error in the independent samples t test?A manufacturer of sunflower oil uses machines to distribute liquid ingredients into bottles that move along a filling line. The machine that distributes is working properly when 8 ounces are distributed. Suppose that the average amount distributed in a particular sample of 35 bottles is 7.91 ounces. Assume that the variance of the process is known to be 0.03 ounces squared. Is there evidence that the machine should be stopped (when not 8 ounces are distributed), and production wait for repairs? The lost production from a shutdown is potentially so great that management feels that the level of confidence in the analysis should be 99%.An instructor gives the same final exam every year. She knows that the μ = 79 but the population variance is unknown. She thinks that her current class is advanced, and will do better than past classes (have a higher mean). The class consists of 25 students, and their final exam class mean was 87 with a variance estimate of 400. Assume that the parametric assumptions are NOT violated. Did her class do statistically better than previous classes? Conduct an appropriate statistical test using α = .05. Write your answer using the 8 steps of hypothesis testing.
- An instructor gives the same final exam every year. She knows that the μ = 79 but the population variance is unknown. She thinks that her current class is advanced, and will do better than past classes (have a higher mean). The class consists of 25 students, and their final exam class mean was 87 with a variance estimate of 400. Assume that the parametric assumptions are NOT violated. Did her class do statistically better than previous classes? Conduct an appropriate statistical test using α = .05. Write your answer using the 8 steps of hypothesis testing. Also, could you say whether it is directional or nondirectional please, thank you =)Scores on a certain test are normally distributed with a variance of 90. A researcher wishes to estimate the mean score achieved by all adults on the test. Find the sample size needed to assure a 95 percent confidence interval with a width of 4.Part Variability is critical in the manufacturing of the ball bearings. Large variances in the size of the ball bearings cause bearing failure and rapid wear out. Production standards call for a maximum variance of .0001 when the bearing sizes are measured in inches. A sample of 15 bearings shows a sample standard deviation of .014. a. Compute the 90% confidence interval estimate of the variance of the ball bearings in the population. b. Use a= 0.10 to determine whether the sample indicates that the maximum acceptable variance is being exceeded. Use critical value approach. ( Note: You must state null and alternative hypotheses, compute the test statistic, Report the critical Value, and draw a conclusion.