Investigate the association between eye colour of husbands and eye colour of wives from the data given below: Husbands with light eyes and wives with light eyes Husbands with light eyes and wives with not light eyes 309 %3D 214
Investigate the association between eye colour of husbands and eye colour of wives from the data given below: Husbands with light eyes and wives with light eyes Husbands with light eyes and wives with not light eyes 309 %3D 214

Glencoe Algebra 1, Student Edition, 9780079039897, 0079039898, 2018
18th Edition
ISBN:9780079039897
Author:Carter
Publisher:Carter
Chapter10: Statistics
Section10.5: Comparing Sets Of Data
Problem 14PPS

Related questions
Question
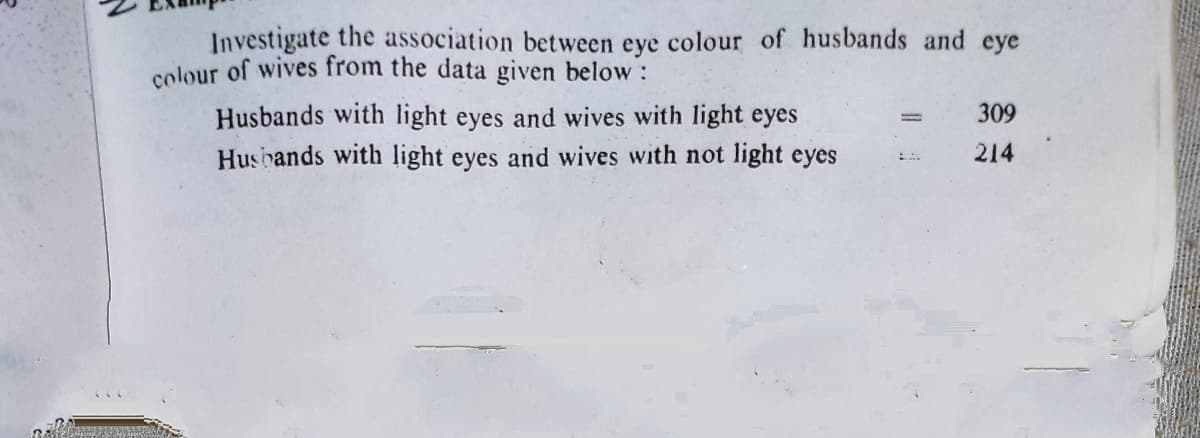
Transcribed Image Text:Investigate the association between eye colour of husbands and eye
colour of wives from the data given below:
Husbands with light eyes and wives with light eyes
Husbands with light eyes and wives with not light eyes
309
214
Expert Solution
This question has been solved!
Explore an expertly crafted, step-by-step solution for a thorough understanding of key concepts.

Step by step
Solved in 2 steps with 2 images

Recommended textbooks for you
Glencoe Algebra 1, Student Edition, 9780079039897…
Algebra
ISBN:
9780079039897
Author:
Carter
Publisher:
McGraw Hill
Glencoe Algebra 1, Student Edition, 9780079039897…
Algebra
ISBN:
9780079039897
Author:
Carter
Publisher:
McGraw Hill