Below is a scatter plot with both a linear model and an exponential model for a group's data set for rolling 6-sided dice.
Below is a scatter plot with both a linear model and an exponential model for a group's data set for rolling 6-sided dice.

Glencoe Algebra 1, Student Edition, 9780079039897, 0079039898, 2018
18th Edition
ISBN:9780079039897
Author:Carter
Publisher:Carter
Chapter10: Statistics
Section10.6: Summarizing Categorical Data
Problem 4DGP

Related questions
Question
Transcribed Image Text:75%
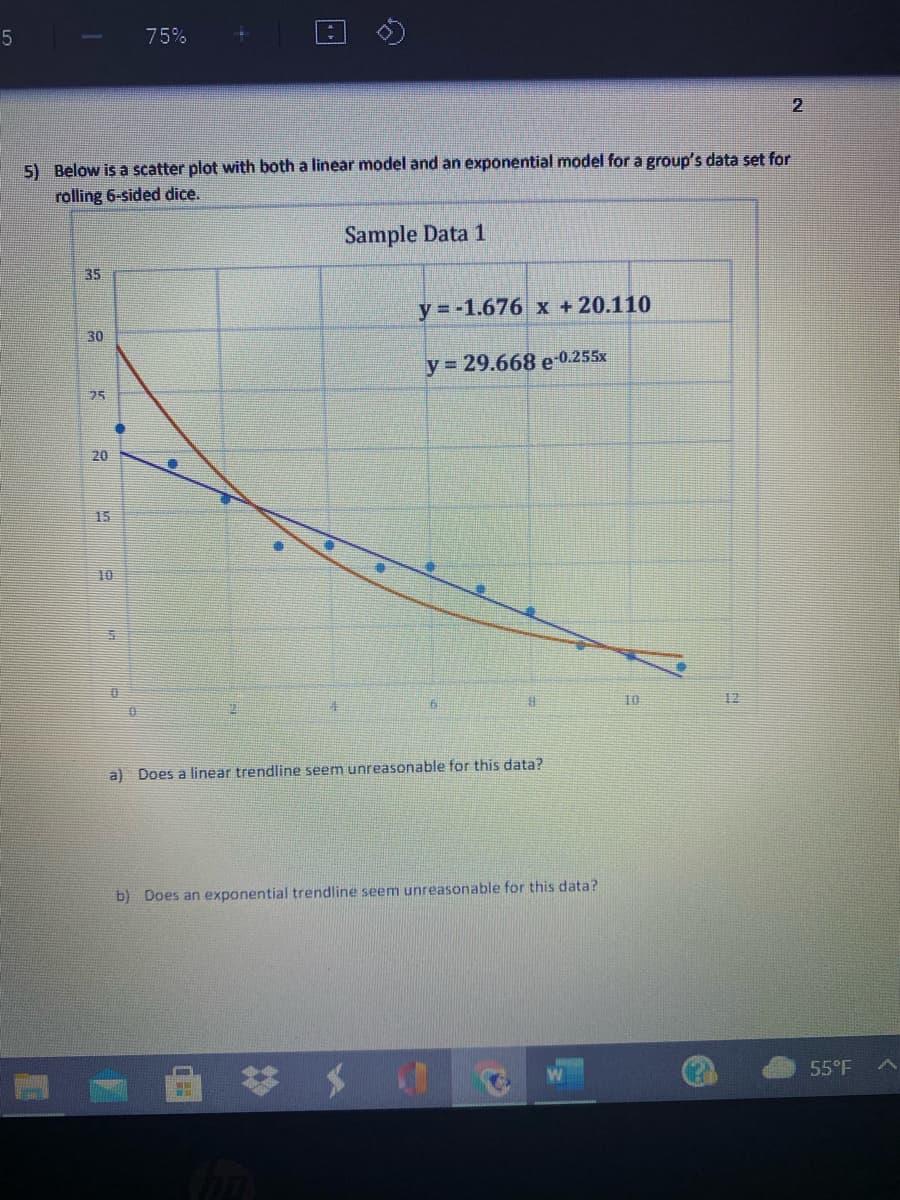
5) Below is a scatter plot with both a linear model and an exponential model for a group's data set for
rolling 6-sided dice.
Sample Data 1
35
y =-1.676 x + 20.110
30
y 29.668 e-0.255x
25
20
15
10
10
12
a) Does a linear trendline seem unreasonable for this data?
b) Does an exponential trendline seem unreasonable for this data?
55°F
Transcribed Image Text:3574a057c1/20573740?X-Blackboard-Expiration3D16365240000008X-Blackboard-Signatu... Q
/ 5
75%
c) Write down the linear model's equation and describe what each of the items in the model
mean in "real-world dice rolling terms".
d) Write down the exponential modeľ's equation and describe what the positive value in the
model means in "real-world dice rolling terms".
e) How come the exponent is negative?
f) Where is the initial value in the linear model?
B) Where is the initial value in the exponential model?
h) Where is the rate in the linear model?
i)
Where is the rate in the exponential model?
Which is a better model for this data? How can you determine this by looking at the chart of
the data?
55°F A O
Expert Solution
This question has been solved!
Explore an expertly crafted, step-by-step solution for a thorough understanding of key concepts.

This is a popular solution!

Trending now
This is a popular solution!

Step by step
Solved in 4 steps

Recommended textbooks for you
Glencoe Algebra 1, Student Edition, 9780079039897…
Algebra
ISBN:
9780079039897
Author:
Carter
Publisher:
McGraw Hill
Glencoe Algebra 1, Student Edition, 9780079039897…
Algebra
ISBN:
9780079039897
Author:
Carter
Publisher:
McGraw Hill