IQ is normally distributed with a mean of 100 and a standard deviation of 15. Suppose one individual is randomly chosen. Let X = IQ of an individual. (a) Find the z-score for an IQ of 99, rounded to three decimal places. (b) Find the probability that the person has an IQ greater than 99. (c) Shade the area corresponding to this probability in the graph below. (Hint: The x- axis is the z-score. Use your z-score from part (a), rounded to one decimal place). Shade: Left of a value -1 -1.5 0 . Click and drag the arrows to adjust the values. ******** (d) MENSA is an organization whose members have the top 2% of all IQs. Find the minimum IQ needed to qualify for the MENSA organization. (e) Sketch the graph, and write the probability statement. Edit Insert Formats BIUX₂ x² A - E = = E· · CORN Edit Insert Formats E (f) The middle 50% of IQs fall between what two values? - (g) Sketch the graph and write the probability statement. B I U X₂ Xº C & R 用 4 <> Σ+ Σ Α Σ+ Σ Α
IQ is normally distributed with a mean of 100 and a standard deviation of 15. Suppose one individual is randomly chosen. Let X = IQ of an individual. (a) Find the z-score for an IQ of 99, rounded to three decimal places. (b) Find the probability that the person has an IQ greater than 99. (c) Shade the area corresponding to this probability in the graph below. (Hint: The x- axis is the z-score. Use your z-score from part (a), rounded to one decimal place). Shade: Left of a value -1 -1.5 0 . Click and drag the arrows to adjust the values. ******** (d) MENSA is an organization whose members have the top 2% of all IQs. Find the minimum IQ needed to qualify for the MENSA organization. (e) Sketch the graph, and write the probability statement. Edit Insert Formats BIUX₂ x² A - E = = E· · CORN Edit Insert Formats E (f) The middle 50% of IQs fall between what two values? - (g) Sketch the graph and write the probability statement. B I U X₂ Xº C & R 用 4 <> Σ+ Σ Α Σ+ Σ Α

A First Course in Probability (10th Edition)
10th Edition
ISBN:9780134753119
Author:Sheldon Ross
Publisher:Sheldon Ross
Chapter1: Combinatorial Analysis
Section: Chapter Questions
Problem 1.1P: a. How many different 7-place license plates are possible if the first 2 places are for letters and...

Related questions
Question
100%
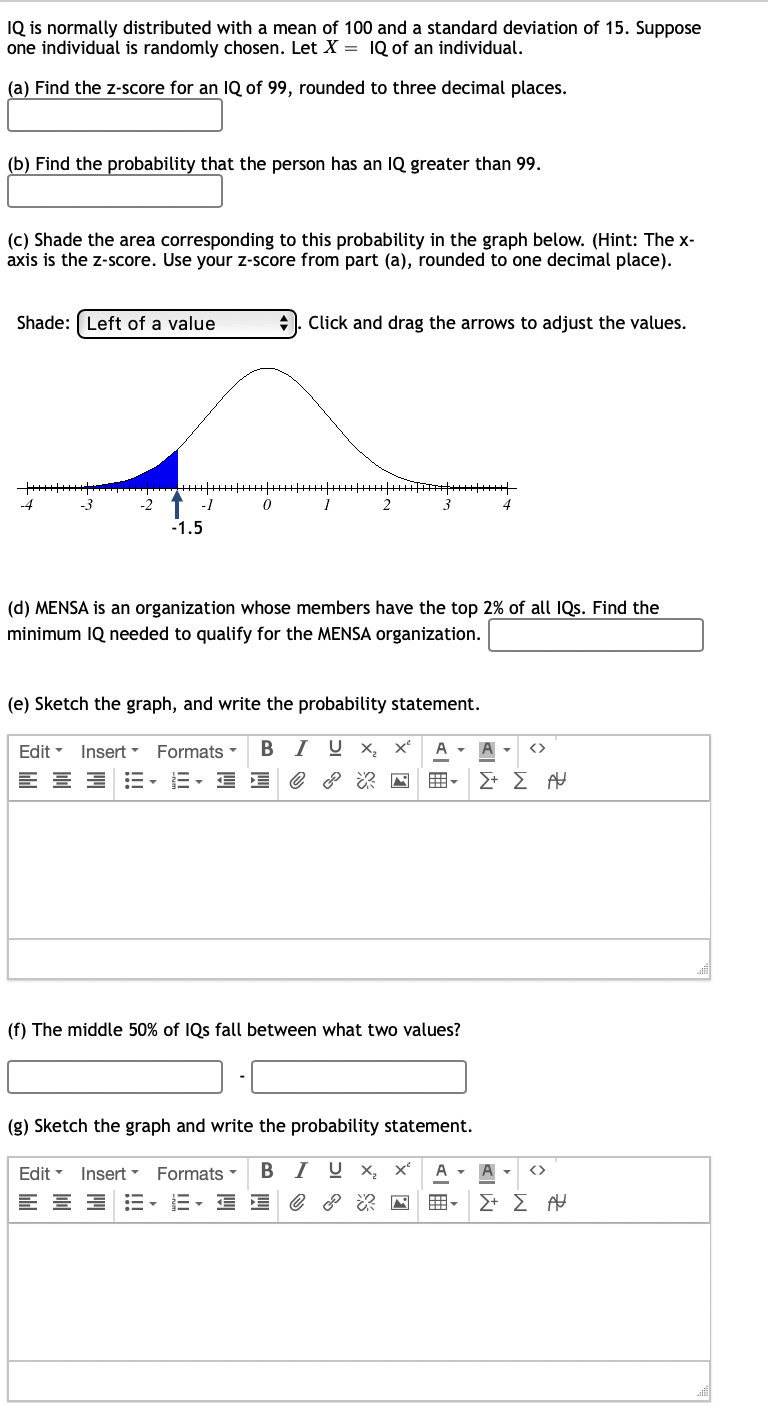
Transcribed Image Text:IQ is normally distributed with a mean of 100 and a standard deviation of 15. Suppose
one individual is randomly chosen. Let X = IQ of an individual.
(a) Find the z-score for an IQ of 99, rounded to three decimal places.
(b) Find the probability that the person has an IQ greater than 99.
(c) Shade the area corresponding to this probability in the graph below. (Hint: The x-
axis is the z-score. Use your z-score from part (a), rounded to one decimal place).
Shade: Left of a value
-1
-1.5
0
+). Click and drag the arrows to adjust the values.
1
2
(d) MENSA is an organization whose members have the top 2% of all IQs. Find the
minimum IQ needed to qualify for the MENSA organization.
(e) Sketch the graph, and write the probability statement.
Edit Insert Formats B I U x₂ x² A
=> EM e & N
18
(f) The middle 50% of IQs fall between what two values?
(g) Sketch the graph and write the probability statement.
Edit Insert Formats BIUX₂ X² A
E = = E EC P R N
•
Σ+ Σ Α
Σ+ Σ Α
Expert Solution
This question has been solved!
Explore an expertly crafted, step-by-step solution for a thorough understanding of key concepts.

This is a popular solution!

Trending now
This is a popular solution!

Step by step
Solved in 4 steps with 2 images

Recommended textbooks for you
A First Course in Probability (10th Edition)
Probability
ISBN:
9780134753119
Author:
Sheldon Ross
Publisher:
PEARSON

A First Course in Probability (10th Edition)
Probability
ISBN:
9780134753119
Author:
Sheldon Ross
Publisher:
PEARSON