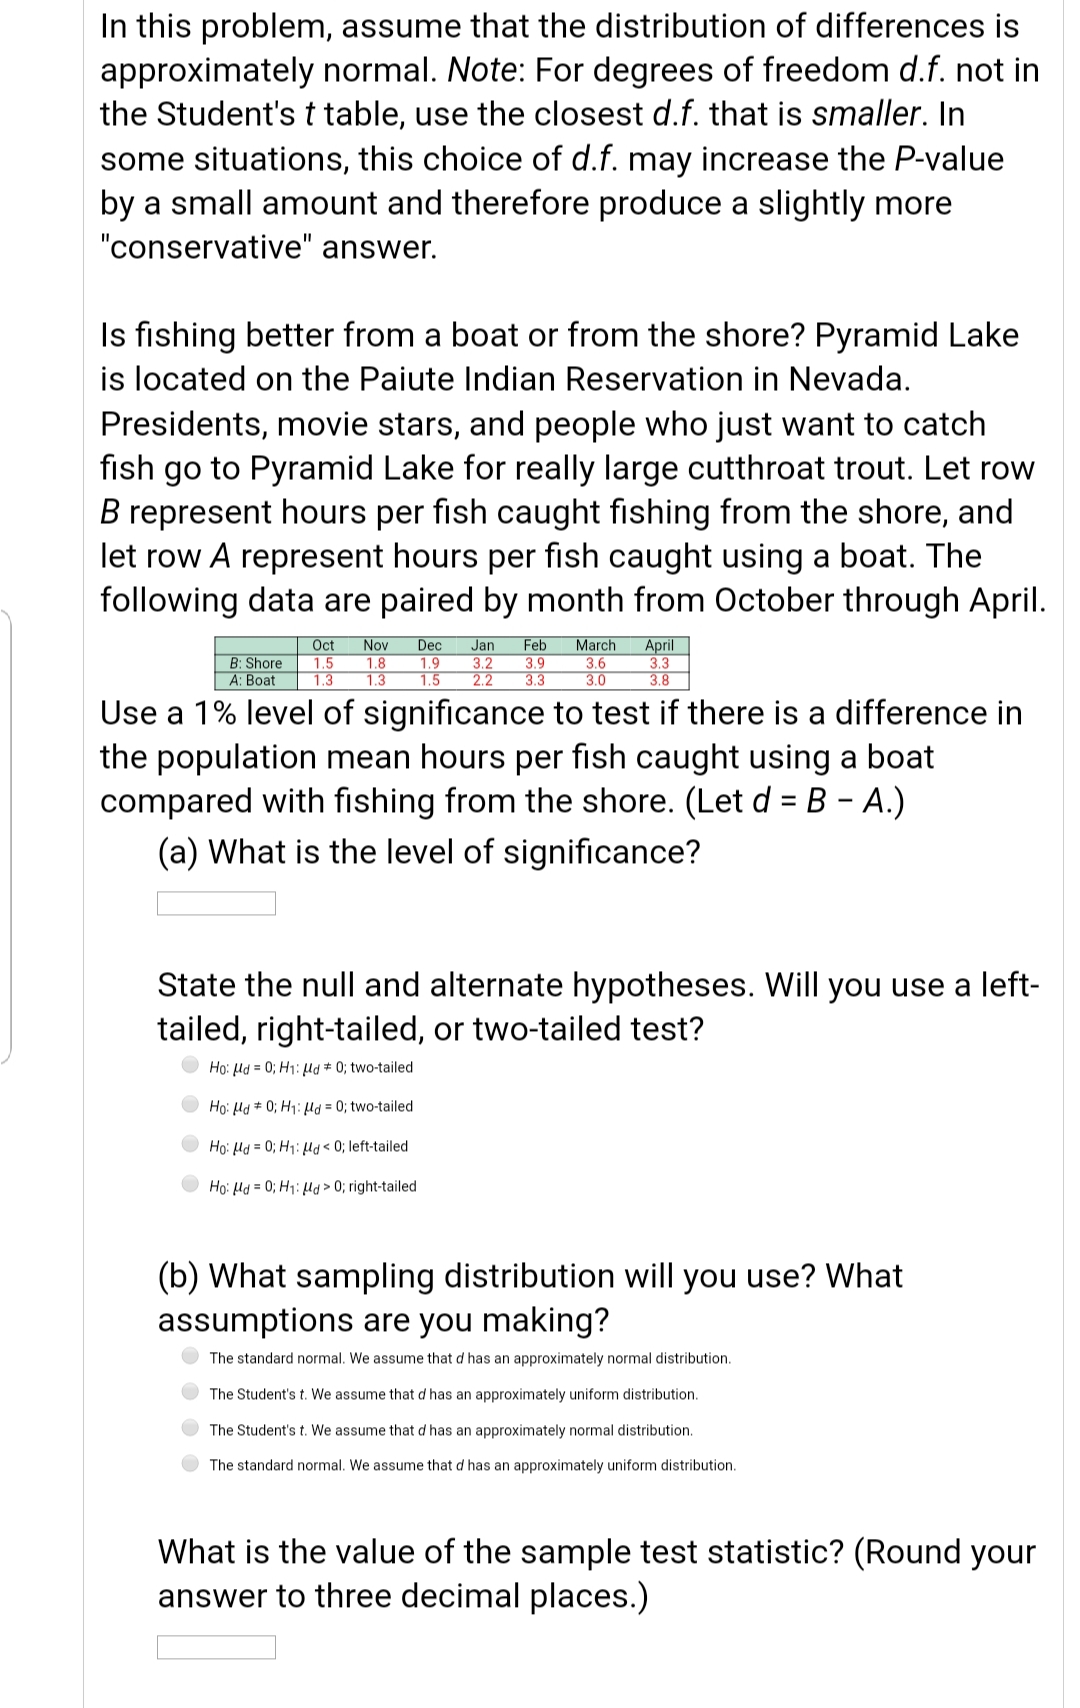
Is fishing better from a boat or from the shore? Pyramid Lake is located on the Paiute Indian Reservation in Nevada. Presidents, movie stars, and people who just want to catch fish go to Pyramid Lake for really large cutthroat trout. Let row B represent hours per fish caught fishing from the shore, and let row A represent hours per fish caught using a boat. The following data are paired by month from October through April. B: Shore A: Boat Oct 1.5 1.3 Nov 1.8 1.3 Dec Jan 1.9 3.2 1.5 2.2 Feb 3.9 3.3 March 3.6 3.0 April 3.3 3.8 Use a 1% level of significance to test if there is a difference in the population mean hours per fish caught using a boat compared with fishing from the shore. (Let d = B - A.) (a) What is the level of significance? State the null and alternate hypotheses. Will you use a left- tailed, right-tailed, or two-tailed test? Họ: ld = 0; H1: µd * 0; two-tailed Ho: Hd # 0; H1: µd = 0; two-tailed Ho: Hd = 0; H1: Hd < 0; left-tailed Ho: Hd = 0; H1: Hd> 0; right-tailed (b) What sampling distribution will you use? What assumptions are you making? The standard normal. We assume that d has an approximately normal distribution. The Student's t. We assume that d has an approximately uniform distribution. The Student's t. We assume that d has an approximately normal distribution. The standard normal. We assume that d has an approximately uniform distribution. What is the value of the sample test statistic? (Round your answer to three decimal places.)


Inverse Normal Distribution
The method used for finding the corresponding z-critical value in a normal distribution using the known probability is said to be an inverse normal distribution. The inverse normal distribution is a continuous probability distribution with a family of two parameters.
Mean, Median, Mode
It is a descriptive summary of a data set. It can be defined by using some of the measures. The central tendencies do not provide information regarding individual data from the dataset. However, they give a summary of the data set. The central tendency or measure of central tendency is a central or typical value for a probability distribution.
Z-Scores
A z-score is a unit of measurement used in statistics to describe the position of a raw score in terms of its distance from the mean, measured with reference to standard deviation from the mean. Z-scores are useful in statistics because they allow comparison between two scores that belong to different normal distributions.


Trending now
This is a popular solution!

Step by step
Solved in 4 steps with 4 images


