Is it okay if I ask for a step-by-step for a question with multiple parts? I don't want the answers, just a guide on how to solve it myself. I especially need help with margins of error, confidence intervals, and how to do the Excel steps because I have a lot of trouble with those. If it's not okay, I'll delete the question. The assignment is in the photos and so are the National Statistics. Here is the chart for the assignment:
Is it okay if I ask for a step-by-step for a question with multiple parts? I don't want the answers, just a guide on how to solve it myself. I especially need help with margins of error, confidence intervals, and how to do the Excel steps because I have a lot of trouble with those. If it's not okay, I'll delete the question. The assignment is in the photos and so are the National Statistics. Here is the chart for the assignment:

Linear Algebra: A Modern Introduction
4th Edition
ISBN:9781285463247
Author:David Poole
Publisher:David Poole
Chapter2: Systems Of Linear Equations
Section2.4: Applications
Problem 26EQ

Related questions
Question
100%
Is it okay if I ask for a step-by-step for a question with multiple parts? I don't want the answers, just a guide on how to solve it myself. I especially need help with margins of error, confidence intervals, and how to do the Excel steps because I have a lot of trouble with those. If it's not okay, I'll delete the question. The assignment is in the photos and so are the National Statistics. Here is the chart for the assignment:
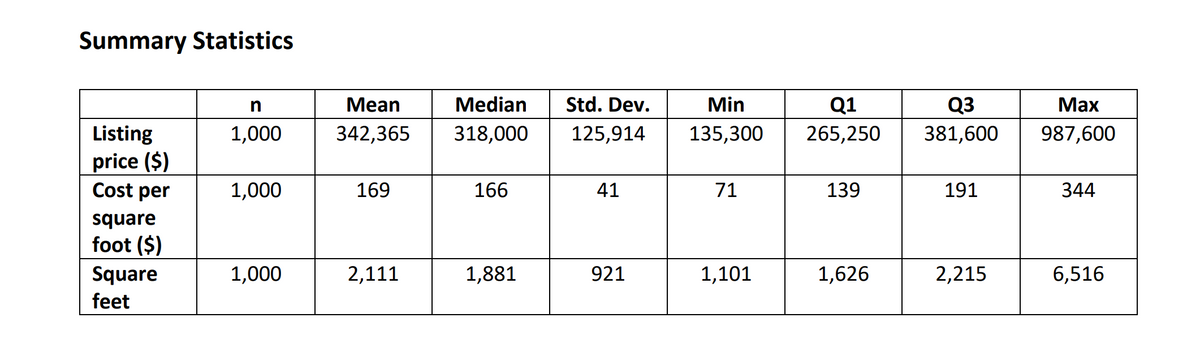
Transcribed Image Text:Summary Statistics
n
Мean
Median
Std. Dev.
Min
Q1
Q3
Маx
Listing
1,000
342,365
318,000
125,914
135,300
265,250
381,600
987,600
price ($)
Cost per
1,000
169
166
41
71
139
191
344
square
foot ($)
Square
1,000
2,111
1,881
921
1,101
1,626
2,215
6,516
feet

Transcribed Image Text:4:42
Scenario
You have been hired by your regional real
estate company to determine if your region's
housing prices and housing square footage are
significantly different from those of the
national market. The regional sales director
has three questions that they want to see
addressed in the report:
1. Are housing prices in your regional
market lower than the national market
average?
2. Is the square footage for homes in your
region different than the average square
footage for homes in the national
market?
3. For your region, what is the range of
values for the 95% confidence interval of
square footage for homes in your
market?
You are given a real estate data set that has
houses listed for every county in the United
States. In addition, you have been given
national statistics and graphs that show the
national averages for housing prices and
square footage. Your job is to analyze the data,
complete the statistical analyses, and provide
a report to the regional sales director. You will
do so by completing the Project Two Template
located in the What to Submit area below.
Directions
Introduction
1. Region: Start by picking one region from
the following list of regions:
West South Central, West North Central,
East South Central, East North Central,
Mid Atlantic
2. Purpose: What was the purpose of your
analysis, and what is your approach?
a. Define a random sample and two
hypotheses (means) to analyze.
3. Sample: Define your sample. Take a
random sample of 500 observations for
your region.
a. Describe what is included in your
sample (i.e., states, region, years or
months).
4. Questions and type of test: For your
selected sample, define two hypothesis
questions and the appropriate type of
test hypothesis for each. Address the
following for each hypothesis:
a. Describe the population parameter
for the variable you are analyzing.
b. Describe your hypothesis in your
own words.
c. Describe the inference test you will
use.
i. Identify the test statistic.
5. Level of confidence: Discuss how you
will use estimation and confidence
intervals to help you solve the problem.
1-Tail Test
1. Hypothesis: Define your hypothesis.
a. Define the population parameter.
b. Write null (Ho) and alternative (Ha)
hypotheses.
c. Specify your significance level.
2. Data analysis: Analyze the data and
confirm assumptions have not been
violated to complete this hypothesis test.
a. Summarize your sample data using
appropriate graphical displays and
summary statistics.
i. Provide at least one histogram
of your sample data.
ii. In a table, provide summary
statistics including sample size,
mean, median, and standard
deviation.
iii. Summarize your sample data,
describing the center, spread,
and shape in comparison to
the national information.
b. Check the conditions.
i. Determine if the normal
condition has been met.
ji. Determine if there are any
other conditions that you
should check and whether they
have been met.
3. Hypothesis test calculations: Complete
hypothesis test calculations, providing
the appropriate statistics and graphs.
a. Calculate the hypothesis statistics.
i. Determine the appropriate test
statistic (†).
ii. Calculate the probability (p
value).
4. Interpretation: Interpret your hypothesis
test results using the p value method to
reject or not reject the null hypothesis.
a. Relate the p value and significance
level.
b. Make the correct decision (reject or
fail to reject).
c. Provide a conclusion in the context
of your hypothesis.
2-Tail Test
a. Hypotheses: Define your hypothesis.
1. Define the population parameter.
2. Write null and alternative
hypotheses.
3. State your significance level.
b. Data analysis: Analyze the data and
confirm assumptions have not been
violated to complete this hypothesis test.
a. Summarize your sample data using
appropriate graphical displays and
summary statistics.
i. Provide at least one histogram
of your sample data.
ii. In a table, provide summary
statistics including sample size,
mean, median, and standard
deviation.
iii. Summarize your sample data,
describing the center, spread,
and shape in comparison to
the national information.
b. Check the assumptions.
i. Determine if the normal
condition has been met.
ii. Determine if there are any
other conditions that should
be checked on and whether
they have been met.
c. Hypothesis test calculations: Complete
hypothesis test calculations, providing
the appropriate statistics and graphs.
a. Calculate the hypothesis statistics.
i. Determine the appropriate test
statistic (t).
ii. Determine the probability (p
value).
d. Interpretation: Interpret your hypothesis
test results using the p value method to
reject or not reject the null hypothesis.
a. Relate the p value and significance
level.
b. Make the correct decision (reject or
fail to reject).
c. Provide a conclusion in the context
of your hypothesis.
e. Comparison of the test results: See
Question 3 from the Scenario section.
a. Calculate a 95% confidence interval.
Show or describe your method of
calculation.
b. Interpret a 95% confidence interval.
Final Conclusions
1. Summarize your findings: Refer back to
the Introduction section above and
summarize your findings of the sample
you selected.
2. Discuss: Discuss whether you were
surprised by the findings. Why or why
not?
Expert Solution
This question has been solved!
Explore an expertly crafted, step-by-step solution for a thorough understanding of key concepts.

This is a popular solution!

Trending now
This is a popular solution!

Step by step
Solved in 5 steps

Recommended textbooks for you
Linear Algebra: A Modern Introduction
Algebra
ISBN:
9781285463247
Author:
David Poole
Publisher:
Cengage Learning
Linear Algebra: A Modern Introduction
Algebra
ISBN:
9781285463247
Author:
David Poole
Publisher:
Cengage Learning