Is the attached problem a two sample test for a two sample normal means hypothesis test? Not sure how to answer the problem.
Is the attached problem a two sample test for a two sample normal means hypothesis test? Not sure how to answer the problem.

MATLAB: An Introduction with Applications
6th Edition
ISBN:9781119256830
Author:Amos Gilat
Publisher:Amos Gilat
Chapter1: Starting With Matlab
Section: Chapter Questions
Problem 1P

Related questions
Topic Video
Question
Is the attached problem a two sample test for a two sample normal means hypothesis test? Not sure how to answer the problem.
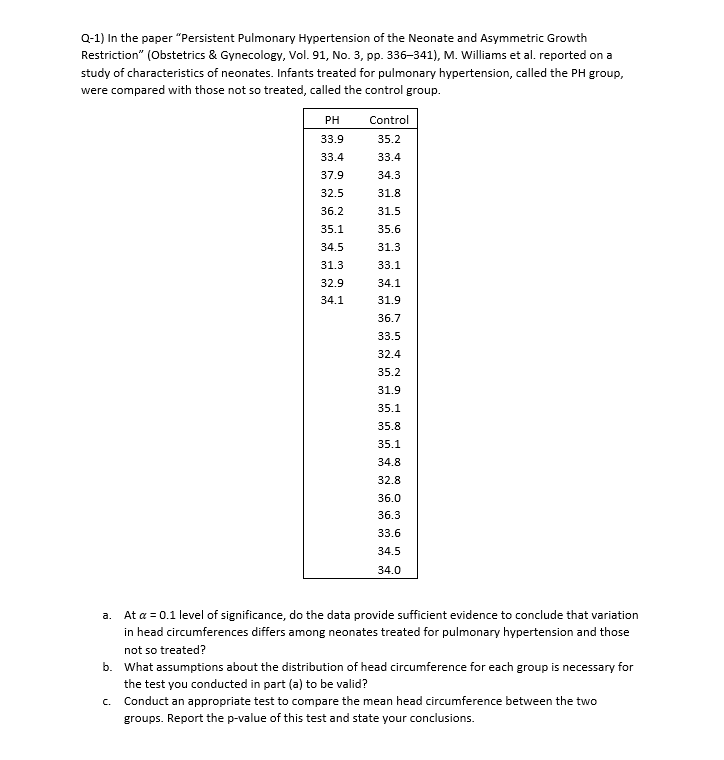
Transcribed Image Text:Q-1) In the paper "Persistent Pulmonary Hypertension of the Neonate and Asymmetric Growth
Restriction" (Obstetrics & Gynecology, Vol. 91, No. 3, pp. 336-341), M. Williams et al. reported on a
study of characteristics of neonates. Infants treated for pulmonary hypertension, called the PH group,
were compared with those not so treated, called the control group.
PH
Control
33.9
35.2
33.4
33.4
37.9
34.3
32.5
31.8
36.2
31.5
35.1
35.6
34.5
31.3
31.3
33.1
32.9
34.1
34.1
31.9
36.7
33.5
32.4
35.2
31.9
35.1
35.8
35.1
34.8
32.8
36.0
36.3
33.6
34.5
34.0
a. At a = 0.1 level of significance, do the data provide sufficient evidence to conclude that variation
in head circumferences differs among neonates treated for pulmonary hypertension and those
not so treated?
b. What assumptions about the distribution of head circumference for each group is necessary for
the test you conducted in part (a) to be valid?
c. Conduct an appropriate test to compare the mean head circumference between the two
groups. Report the p-value of this test and state your conclusions.
Expert Solution
This question has been solved!
Explore an expertly crafted, step-by-step solution for a thorough understanding of key concepts.

This is a popular solution!

Trending now
This is a popular solution!

Step by step
Solved in 3 steps with 3 images

Knowledge Booster


Learn more about
Need a deep-dive on the concept behind this application? Look no further. Learn more about this topic, statistics and related others by exploring similar questions and additional content below.Recommended textbooks for you
MATLAB: An Introduction with Applications
Statistics
ISBN:
9781119256830
Author:
Amos Gilat
Publisher:
John Wiley & Sons Inc

Probability and Statistics for Engineering and th…
Statistics
ISBN:
9781305251809
Author:
Jay L. Devore
Publisher:
Cengage Learning

Statistics for The Behavioral Sciences (MindTap C…
Statistics
ISBN:
9781305504912
Author:
Frederick J Gravetter, Larry B. Wallnau
Publisher:
Cengage Learning
MATLAB: An Introduction with Applications
Statistics
ISBN:
9781119256830
Author:
Amos Gilat
Publisher:
John Wiley & Sons Inc
Probability and Statistics for Engineering and th…
Statistics
ISBN:
9781305251809
Author:
Jay L. Devore
Publisher:
Cengage Learning
Statistics for The Behavioral Sciences (MindTap C…
Statistics
ISBN:
9781305504912
Author:
Frederick J Gravetter, Larry B. Wallnau
Publisher:
Cengage Learning

Elementary Statistics: Picturing the World (7th E…
Statistics
ISBN:
9780134683416
Author:
Ron Larson, Betsy Farber
Publisher:
PEARSON

The Basic Practice of Statistics
Statistics
ISBN:
9781319042578
Author:
David S. Moore, William I. Notz, Michael A. Fligner
Publisher:
W. H. Freeman

Introduction to the Practice of Statistics
Statistics
ISBN:
9781319013387
Author:
David S. Moore, George P. McCabe, Bruce A. Craig
Publisher:
W. H. Freeman