Is the difference between the two indicators significant at the 95% confidence level?

MATLAB: An Introduction with Applications
6th Edition
ISBN:9781119256830
Author:Amos Gilat
Publisher:Amos Gilat
Chapter1: Starting With Matlab
Section: Chapter Questions
Problem 1P

Related questions
Question
Write clearly so I can see
![8. (12) An analyst measured the concentration of acid in a solution using two different
indicators. His results were as follows:
Mean [HCI] F stand. Dev.
0.02467 F 0.0045
0.02407 † 0.0032
# measurements
Indicator A:
18
Indicator B:
12
Is the difference between the two indicators significant at the 95% confidence level?
15
etv
MacBook Air
20
F3
DI
DD
F4
F5
F6
F7
F8
F9
F10
23
$
%
&
*
3
4
7
8
9
E
Y
G
KI L](/v2/_next/image?url=https%3A%2F%2Fcontent.bartleby.com%2Fqna-images%2Fquestion%2Fc0e9075b-7256-4c60-9413-d015032a29f3%2F3e2e33af-1674-45be-961d-53acc86adc71%2Fkmdv41n_processed.jpeg&w=3840&q=75)
Transcribed Image Text:8. (12) An analyst measured the concentration of acid in a solution using two different
indicators. His results were as follows:
Mean [HCI] F stand. Dev.
0.02467 F 0.0045
0.02407 † 0.0032
# measurements
Indicator A:
18
Indicator B:
12
Is the difference between the two indicators significant at the 95% confidence level?
15
etv
MacBook Air
20
F3
DI
DD
F4
F5
F6
F7
F8
F9
F10
23
$
%
&
*
3
4
7
8
9
E
Y
G
KI L
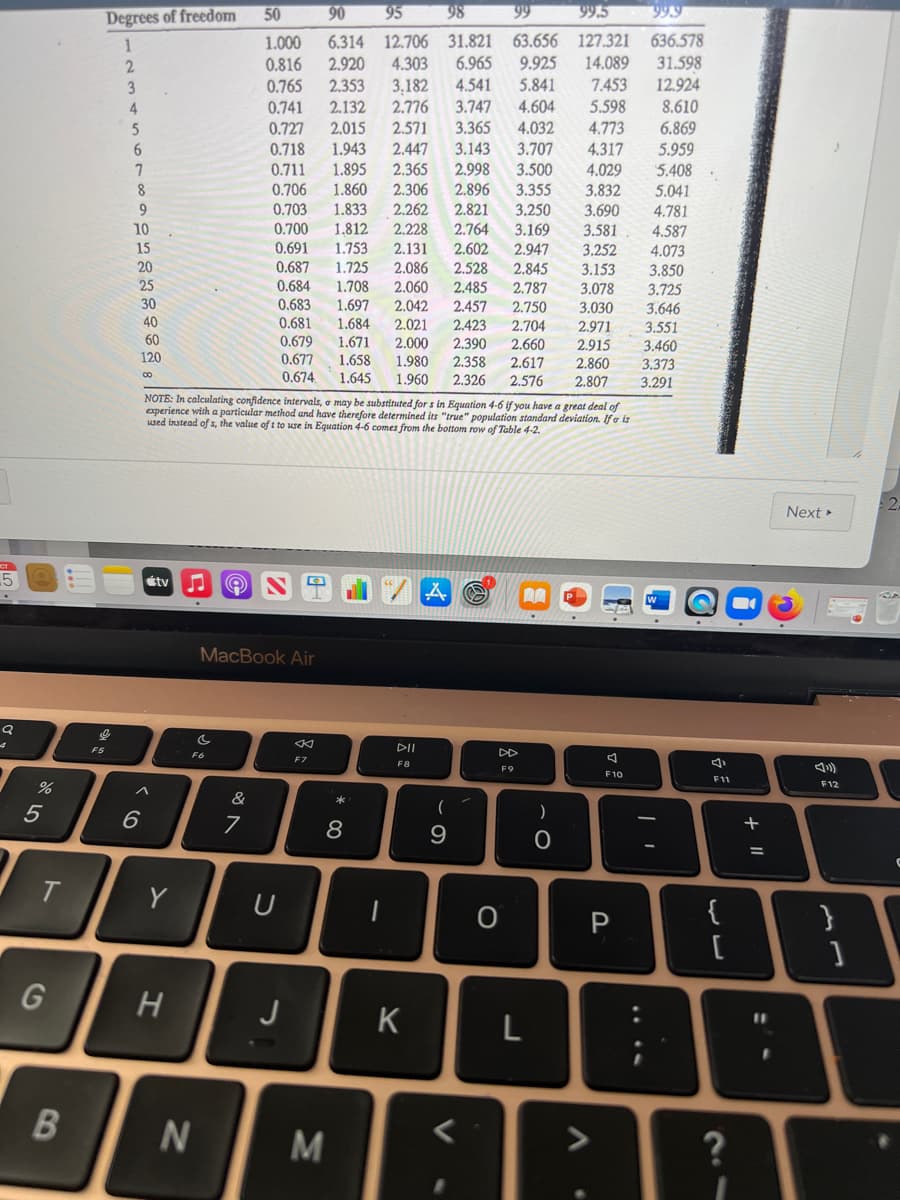
Transcribed Image Text:Degrees of freedom
50
90
95
98
99
99.5 99.9
1.000
0.816
0.765
6.314 12.706 31.821
2.920
2.353
63.656 127.321 636.578
9.925
1
4.303
6.965
14.089
31.598
3,182
2.776
2.571
12.924
4.541
3.747
3.365
3
5.841
7.453
2.132
2,015
1.943
1.895
1.860
5.598
4.604
4.032
8.610
6.869
4
0.741
0.727
0.718
4.773
6.
2.447
3.143
3.707
4.317
5.959
0.711
2.365
2.998
3.500
4.029
5.408
0.706
0.703
8
2.306
2.896
3.355
3.832
5.041
9
1.833
2.262
2.821
3.250
3.690
4.781
10
0.700
1.812
2.228
2.764
3.169
3.581
4.587
0.691
0.687
1.753
1.725
1.708
1.697
15
2.131
2.602
2.947
3.252
4.073
20
2.086
2.528
2.845
3.153
3.850
25
0.684
2.060
2.485
2.787
3.078
3.725
30
0.683
0.681
0.679
0.677
2.042
2.457
2.750
3.030
3.646
40
1.684
1.671
1.658
1.645
2.021
2.000
1.980
2.423
2.704
2.660
2.971
3.551
60
2,390
2.358
2.326
2.915
3.460
3.373
120
2.617
2.576
2.860
0.674.
1.960
2.807
3.291
NOTE: In calculating confidence intervals, a may be substituted for s in Equation 4-6 if you have a great deal of
experience with a particular method and have therefore determined its "true" population standard deviation. If o is
used instead ofs, the value of t to use in Equation 4-6 comes from the bottom row of Table 4-2.
Next
5
étv
MacBook Air
F5
DI
F6
F7
F8
F9
F10
F11
F12
&
*
6.
%3D
Y
{
}
J
B
N
M
+ ||
* CO
Expert Solution
This question has been solved!
Explore an expertly crafted, step-by-step solution for a thorough understanding of key concepts.

This is a popular solution!

Trending now
This is a popular solution!

Step by step
Solved in 2 steps with 2 images

Recommended textbooks for you
MATLAB: An Introduction with Applications
Statistics
ISBN:
9781119256830
Author:
Amos Gilat
Publisher:
John Wiley & Sons Inc

Probability and Statistics for Engineering and th…
Statistics
ISBN:
9781305251809
Author:
Jay L. Devore
Publisher:
Cengage Learning

Statistics for The Behavioral Sciences (MindTap C…
Statistics
ISBN:
9781305504912
Author:
Frederick J Gravetter, Larry B. Wallnau
Publisher:
Cengage Learning
MATLAB: An Introduction with Applications
Statistics
ISBN:
9781119256830
Author:
Amos Gilat
Publisher:
John Wiley & Sons Inc
Probability and Statistics for Engineering and th…
Statistics
ISBN:
9781305251809
Author:
Jay L. Devore
Publisher:
Cengage Learning
Statistics for The Behavioral Sciences (MindTap C…
Statistics
ISBN:
9781305504912
Author:
Frederick J Gravetter, Larry B. Wallnau
Publisher:
Cengage Learning

Elementary Statistics: Picturing the World (7th E…
Statistics
ISBN:
9780134683416
Author:
Ron Larson, Betsy Farber
Publisher:
PEARSON

The Basic Practice of Statistics
Statistics
ISBN:
9781319042578
Author:
David S. Moore, William I. Notz, Michael A. Fligner
Publisher:
W. H. Freeman

Introduction to the Practice of Statistics
Statistics
ISBN:
9781319013387
Author:
David S. Moore, George P. McCabe, Bruce A. Craig
Publisher:
W. H. Freeman