Is the test statistic in the rejection region? How do you know?

College Algebra (MindTap Course List)
12th Edition
ISBN:9781305652231
Author:R. David Gustafson, Jeff Hughes
Publisher:R. David Gustafson, Jeff Hughes
Chapter8: Sequences, Series, And Probability
Section8.CT: Chapter Test
Problem 16CT: How many six-digit license plates can be made if no plate begins with 0 or 1?

Related questions
Question
what is C
c.) Is the test statistic in the rejection region? How do you know?
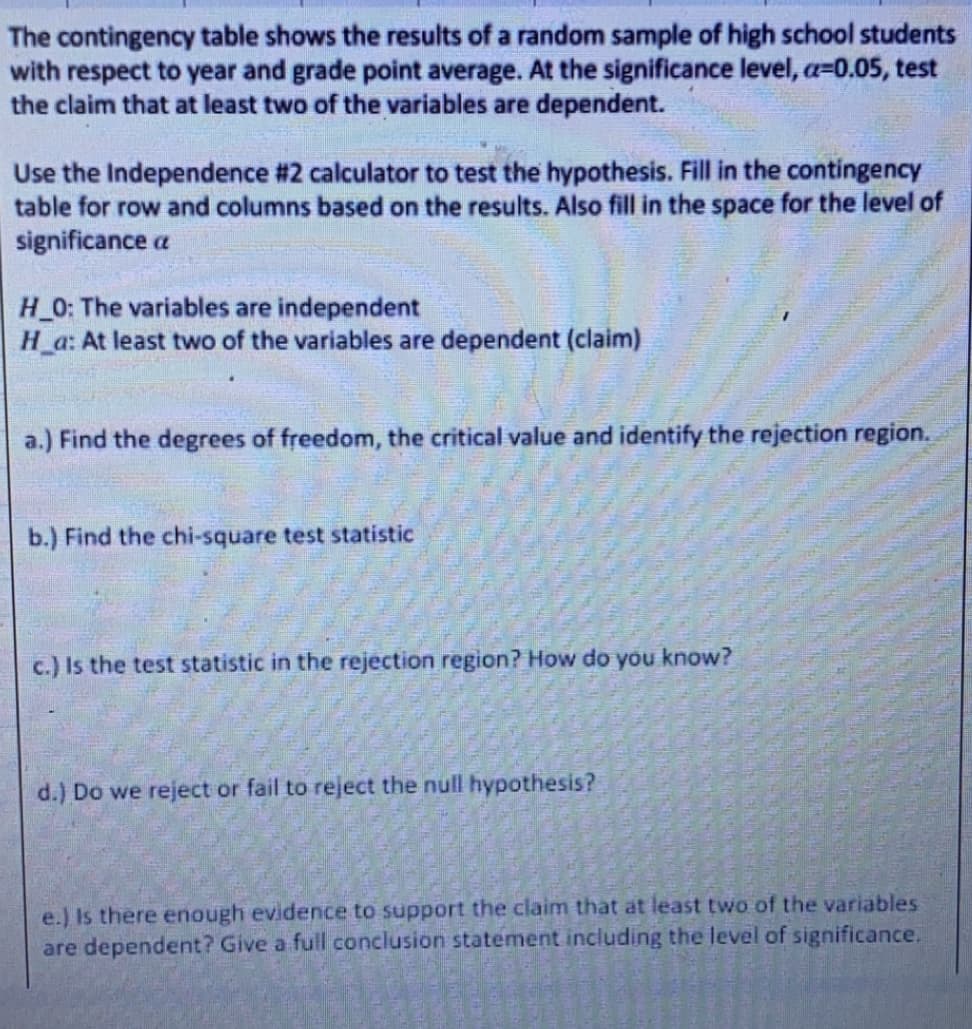
Transcribed Image Text:The contingency table shows the results of a random sample of high school students
with respect to year and grade point average. At the significance level, a-0.05, test
the claim that at least two of the variables are dependent.
Use the Independence #2 calculator to test the hypothesis. Fill in the contingency
table for row and columns based on the results. Also fill in the space for the level of
significance a
H O: The variables are independent
H a: At least two of the variables are dependent (claim)
a.) Find the degrees of freedom, the critical value and identify the rejection region.
b.) Find the chi-square test statistic
c.) Is the test statistic in the rejection region? How do you know?
d.) Do we reject or fail to reject the null hypothesis?
e.) Is there enough evidence to support the claim that at least two of the variables
are dependent? Give a full conclusion statement including the level of significance.
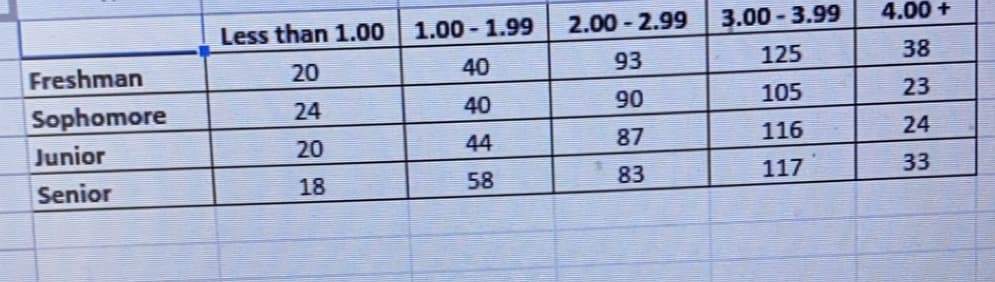
Transcribed Image Text:Less than 1.00
1.00 - 1.99
2.00 - 2.99
3.00 - 3.99
4.00 +
Freshman
20
40
93
125
38
Sophomore
24
40
90
105
23
Junior
20
44
87
116
24
Senior
18
58
83
117
33
Expert Solution
This question has been solved!
Explore an expertly crafted, step-by-step solution for a thorough understanding of key concepts.

Step by step
Solved in 2 steps

Recommended textbooks for you
College Algebra (MindTap Course List)
Algebra
ISBN:
9781305652231
Author:
R. David Gustafson, Jeff Hughes
Publisher:
Cengage Learning

College Algebra (MindTap Course List)
Algebra
ISBN:
9781305652231
Author:
R. David Gustafson, Jeff Hughes
Publisher:
Cengage Learning