Is there a relationship between autism and what an infant is fed? To determine if there is, a researcher asked mothers of autistic and non-autistic children to say what they fed their infant. The data are in table below a) Since data were collected for variable(s), the correct graph to make is a b) Which of the following is the correct graph for the above data with Feeding grouped by Autism.
Is there a relationship between autism and what an infant is fed? To determine if there is, a researcher asked mothers of autistic and non-autistic children to say what they fed their infant. The data are in table below a) Since data were collected for variable(s), the correct graph to make is a b) Which of the following is the correct graph for the above data with Feeding grouped by Autism.

Glencoe Algebra 1, Student Edition, 9780079039897, 0079039898, 2018
18th Edition
ISBN:9780079039897
Author:Carter
Publisher:Carter
Chapter10: Statistics
Section10.6: Summarizing Categorical Data
Problem 23PPS

Related questions
Question
Is there a relationship between autism and what an infant is fed? To determine if there is, a researcher asked mothers of autistic and non-autistic children to say what they fed their infant. The data are in table below
a) Since data were collected for variable(s), the correct graph to make is a
b) Which of the following is the correct graph for the above data with Feeding grouped by Autism.
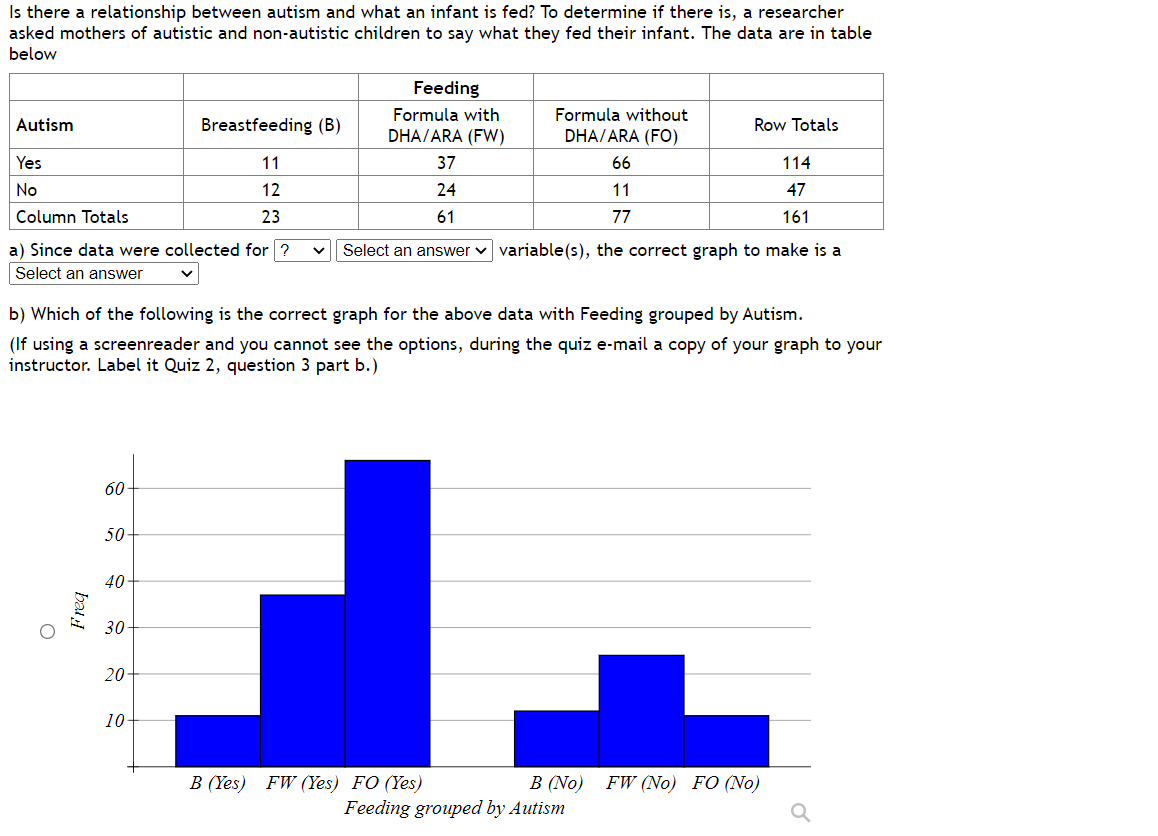
Transcribed Image Text:Is there a relationship between autism and what an infant is fed? To determine if there is, a researcher
asked mothers of autistic and non-autistic children to say what they fed their infant. The data are in table
below
Autism
Yes
No
Column Totals
a) Since data were collected for ?
Select an answer
O
bal
60
50
40
b) Which of the following is the correct graph for the above data with Feeding grouped by Autism.
(If using a screenreader and you cannot see the options, during the quiz e-mail a copy of your graph to your
instructor. Label it Quiz 2, question 3 part b.)
30
Breastfeeding (B)
20
11
12
23
10
Feeding
Formula with
DHA/ARA (FW)
Formula without
DHA/ARA (FO)
Row Totals
37
66
114
24
11
47
61
77
161
Select an answer ✓ variable(s), the correct graph to make is a
B (Yes) FW (Yes) FO (Yes)
B (No) FW (No) FO (No)
Feeding grouped by Autism
a
Expert Solution
This question has been solved!
Explore an expertly crafted, step-by-step solution for a thorough understanding of key concepts.

This is a popular solution!

Trending now
This is a popular solution!

Step by step
Solved in 3 steps with 2 images

Recommended textbooks for you
Glencoe Algebra 1, Student Edition, 9780079039897…
Algebra
ISBN:
9780079039897
Author:
Carter
Publisher:
McGraw Hill

Big Ideas Math A Bridge To Success Algebra 1: Stu…
Algebra
ISBN:
9781680331141
Author:
HOUGHTON MIFFLIN HARCOURT
Publisher:
Houghton Mifflin Harcourt

Holt Mcdougal Larson Pre-algebra: Student Edition…
Algebra
ISBN:
9780547587776
Author:
HOLT MCDOUGAL
Publisher:
HOLT MCDOUGAL
Glencoe Algebra 1, Student Edition, 9780079039897…
Algebra
ISBN:
9780079039897
Author:
Carter
Publisher:
McGraw Hill
Big Ideas Math A Bridge To Success Algebra 1: Stu…
Algebra
ISBN:
9781680331141
Author:
HOUGHTON MIFFLIN HARCOURT
Publisher:
Houghton Mifflin Harcourt
Holt Mcdougal Larson Pre-algebra: Student Edition…
Algebra
ISBN:
9780547587776
Author:
HOLT MCDOUGAL
Publisher:
HOLT MCDOUGAL