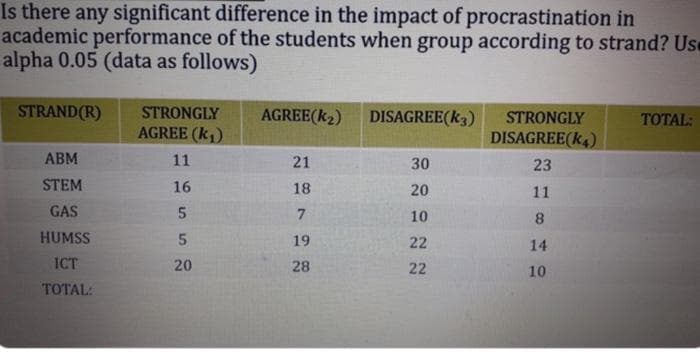
Is there any significant difference in the impact of procrastination in academic performance of the students when group according to strand? U alpha 0.05 (data as follows) STRAND(R) STRONGLY AGREE (K₁) AGREE(K₂) DISAGREE(K3) TOTAL STRONGLY DISAGREE(K4) ABM 11 21 30 23 STEM 16 18 20 11 GAS 5 7 8 LILIMSC 10


Q: The mean balance of all checking accounts at a local bank for July 2020 was P8 500. A random sample…
A:
Q: II. Grouped data. 1. One hundred students took the college entrance examination at XYZ University.…
A: The entrance exam scores of 100 students are given. We need to construct the frequency distribution…
Q: (ye-10 f(y) = 0 0 be a constant. i) Find the moment generating function of X = -cy. ii) What is the…
A:
Q: Based on the records of the Admissions Office of University U, the mean score of all Grade 12…
A:
Q: What are 6 statistic problems that can be identified in the following images. Describe completely.
A: Given images of study between Jelly Beans and Acne, Different color of Jelly beans and Acne.
Q: A fast-food restaurant attaches prize coupons to the cups used to serve large drinks. Seventy…
A: The fast-food restaurant attaches prize coupons to the cups.
Q: The number of M&Ms in a 6 oz bag is normally distributed with a mean of 18.45 and a standard…
A:
Q: Match each example with the type of sampling it represents. A survey in the Maldives took place in…
A: The objective is to match each example with the type of sampling.
Q: There are 7 students who are left-handed and 25 students who are right-handed in Miss Hill’s class.…
A: No .of students who are left-handed in Miss Hill’s class=7 No .of students who are right-handed in…
Q: The proportion of the stationary supply sold during the month is a beta random variable with a = 4…
A: Let X denote the proportion of the stationary supply sold during a month. Given that X follows Beta…
Q: nsity function of a random variable Y be y, f(y)=2-y, 2-y, 0≤x≤1 1<x<2 0, otherwise
A:
Q: 1. Please explain the Empirical Rule. Why we cannot use Chebyshev's Theorem in Normal Distributions?…
A: Since you have asked multiple questions, we will solve the first question for you. If you want any…
Q: i) Find the moment generating function of X = -cY. ii) What is the distribution of X?
A:
Q: Suppose that a random variable y is uniformly distributed on an interval (0,1) and let c> 0 be…
A:
Q: Data on pull-off force (pounds) for connectors used in an automobile engine application are as…
A: Disclaimer : “Since you have posted a question with multiple sub-parts, we will solve first three…
Q: What is the total of x (age)? Input the number ONLY. * Your answer What is the total of y (time)?…
A: We have given that the data of person’s age and time spent on social media in a day.
Q: the average hardness of tablets is centered on the target of 6 kp, while LCL and UCL are 5 and 7…
A:
Q: B. in the table with the data which are relevant to the field of medicine/nursing. Identify as to…
A: The objective is to fill the table with relevant data to the field of medicine or nursing and to…
Q: Angela recently discovered that the proportion of cat owners in Scranton, Pennsylvania, is 0.27.…
A: We have given that n = 200 p = 0.27
Q: After a while, they went to Haknyeon's Family Restaurant. On the shelf, there are 100 distinct…
A: It is given that Number of small cakes = 35 Number of blue cakes = 30 Number of small blue cakes =…
Q: It has been claimed that during ECQ, the average number of hours that a millennial spends watching…
A: Given that Sample size n =100 Sample mean =144 Population standard deviation =20
Q: What is the interval that would contain all of the values that lie within one standard deviation of…
A:
Q: 3. A random sample of 25 observations taken from a population that is normally distributed produced…
A:
Q: 8. It is claimed by an advertisement that 4 out of 5 kids have energy gap. To test this, a random…
A:
Q: Find the area, to the nearest thousandth, of the standard normal distribution between the given…
A:
Q: Is there a significant relationship between a person's age and time spent on social media in a day?…
A: The question is based on a testing of correlation coeff. Given data : Level of signif. ( α ) = 0.05…
Q: Two-Face decided to kill time by flipping four distinct coins. Describe Two-Face's imagined scenario…
A: Four distinct coins are flipped with some outcomes. The scenarios are to be described based on the…
Q: In a genetics experiment on peas, one sample of offspring contained 406 green peas and 25 yellow…
A:
Q: 5. A professor at a community college claims that a college algebra student can increase his or her…
A:
Q: Redo exercises 7 and 8 in section 8.3 of your textbook, about the small animal who lives in an area…
A:
Q: Based on the records of the Admissions Office of University X, the mean score of all Grade 11…
A:
Q: Es X complet sufficient as IS T(X) = x² complet sufficient
A:
Q: cted according to a uniform distribution. Calculate the expected value of the distance between these…
A: Given: X and Y are two points. Range is 0-1.
Q: d) Find the conditional pdf, f(ylx) and f(xly). e) Are X and Y independent f) Find E(X)
A:
Q: If 20% of the bolts produced by a machine are defective, determine the probability that out of 6…
A: Given: Sample size, n=6 Probability of defective bolt, p=0.20
Q: The height of women ages 20-29 is normally distributed, with a mean of 63.6 inches. Assume σ=2.6…
A:
Q: want to estimate the proportion of all college students who traveled during spring break. survey a…
A: Given that Sample size n =200 Favorable cases x =116 Sample proportion p^=x/n =116/200 =0.58
Q: ind 1. Let X₁, X2, ..., Xn Fx, where Fx is the cumulative distribution function. In Home- work 1,…
A: The probability density function of Xi random variable is fXi(x)=1 for the interval (0, 1) and for…
Q: Q1 The following data represent the price (in cents) of 100 grams of red chilies in the local market…
A: Observation: XX X^2X2 1 52 2704 2 51 2601 3 50 2500 4 50 2500 5 65 4225 6 55 3025 7 53…
Q: The following data represent the price (in cents) of 100 grams of red chilies in the local market…
A: Given data is52,51,50,50,65,55,53,55,52,47,46,44,57,58,55,51,60,62,60,58sample size(n)=20
Q: 3. A random sample of 25 observations taken from a population that is normally distributed produced…
A:
Q: Data was collected for a sample of organic snacks. The amount of sugar (in mg) in each snack is…
A: From the histogram Find n =?
Q: Consider following MLR model. Full Model: y = = Bo + B11+ B2x2 + B3x3 + B4x4 + € Given Information:…
A: Given information: Full model: y=β0+β1·x1+β2·x2+β3·x3+β4·x4+ε n=20, SST=1950 Variables p MSE R2…
Q: What is the appropriate (non-linear) objective function for this scenario (hint: distances are…
A:
Q: 10. It is claimed by an advertisement that 4 out of 5 kids have energy gap. To test this, a random…
A:
Q: If X is a continuous random variable, what is the value of X that will be exceeded 30% of the time,…
A:
Q: A basketball team is down by 2 points with only a few seconds remaining in the game. There is a 50%…
A:
Q: The list shows the number of bottles of strawberry jam sold in a day by different vendors: 19, 16,…
A: Given data is 19,16,10,12,15,13,9,11,17,15,18,20sample size(n)=12
Q: A sociologist found that in a sample of 50 retired men, the average number of jobs they had during…
A:
Q: regularly listen to podcasts. A researcher believes this claimed value is too low. She decides to…
A:

Step by step
Solved in 3 steps with 2 images

- A suburban hotel derives its revenue from its hotel and restaurant operations. Theowners are interested in the relationship between the number of rooms occupied on anightly basis and the revenue per day in the restaurant. Below is a sample of 25 days(Monday through Thursday) from last year showing the restaurant income and numberof rooms occupied.Suppose a researcher is interested inthe effectiveness in a new childhood exercise program implemented in a SRS of schools across a particular county. In order to test the hypothesis that the new program decreases BMI (Kg/m2), the researcher takes a SRS of children from schools where the program is employed and a SRS from schools that do not employ the program and compares the results. Assume the following table represents the SRSs of students and their BMIs. Student intervention group BMI (kg/m2) Student control group BMI (kg/m2) A 18.6 A 21.6 B 18.2 B 18.9 C 19.5 C 19.4 D 18.9 D 22.6 E 24.1 F 23.6 A) Assuming that all the necessary conditions are met (normality, independence, etc.) carry out the appropriate statistical test to determine if the new exercise program is effective. Use an alpha level of 0.05. Do not assume equal variances.B) Construct a 95% confidence interval about your estimate for the average difference in BMI between the groups.What is the critical value of t for an independent samples t test if a researcher conducts a two-tailed test, alpha is set at .05, and there are 40 degrees of freedom?
- A random sample of 50 COS students contained 13 that owned an iPhone. A random sample of 200 Fresno State students contained 70 that owned an iPhone. Use these data to test the claim that the proportion of COS students who own an iPhone is the same as the proportion of Fresno State students who own an iPhone at the 0.05 level of significance.[4-5] CONSIDER that the data is UNCORRELATED use alpha .05. Provide the following: CI of the F value Statistical InterpretationA sample of men and women who had passed their driver's test either the first time or the second time were surveyed, with the following results: Results of the driving testGender First time Second timeMen 126 211Women 135 178a) Do these data suggest that there is a relationship between gender and the passing of their driver’s test from which the present sample was drawn? Let alpha=.05
- . A study is conducted on the relationship of the number of absences (x) and the grades (y) of 15 students in BC212. Using r at 0.05 level of significance and the hypothesis that there is no significant relationship between absences and grades of the students in BC212, determine the relationship using the following data.r.05 = - 0.514Number of Absencesx Grades in BC212y122338614551219 908580758065709580807592898065The results of a state mathematics test for random samples of students taught by two different teachers at the same school are shown below. Can you conclude there is a difference in the mean mathematics test scores for the students of the two teachers? Teacher 1 Teacher 2 xbar = 473 xbar = 459 S1= 39.7 S2 = 24.5 n1 = 8 n2 = 18 Identify the rejection region (critical region) and fail to reject region. Show this by drawing a curve and separate the rejection region from the fail to reject region using critical values.Q3. Kaimura et al. (2000) investigated the effects of procyanidin B-2 tonic on human hair growth after sequential use for 6 months. In one part of the study, the total hair increase (total hairs at month 6 – total hairs at month 0) in the designated scalp area was measured for a sample of 15 men treated with a placebo control and a sample of 25 men treated with a procyanidin B-2 (PB2). The data is contained in the file A2Q3.csv. (This data is simulated based on information in the paper. You must use the data in the file to carry out the analysis). Is there evidence that the total hair increase of the subjects in the procyanidin B-2 group was greater the those in the placebo control group, at the 5% level of significance? State an appropriate null and alternative hypothesis in words and symbols.
- The median pH level of the rain in a certain county, was 4.90. A biologist obtains a random sample of 19 rain dates and obtains the following data. Test the hypothesis that the median pH level has decreased from 4.90 at the alpha= 0.05 level of significance.A 3-sigma control chart is established and the following rule is used to detect out-of-control situations of a normally distributed process. Rule: 2 out of 3 consecutive points are outside of 1.75 sigma but still within the control limits. Compute type 1 error of the rule. Select one: a. 0.0078 b. 0.0776 c. 0.0167 d. 0.0017 e. 0.0145An urban community wants to show that the incidence of breast cancer is higher in their locality than in a neighboring rural area. (PCB levels were found to be higher in the soil of the urban community). If you find that in the urban community 20 out of 200 adult women have breast cancer and that in the rural community 10 out of 150 adult women have it, could you conclude, at a significance level of 0.05, that breast cancer is more prevalent in the urban community?1. The parameter of interest is:2. The hypotheses for this test are:3. The calculated test statistic is:4. The critical region is:5. Draw the critical region (make decision):6. It can be concluded that: