istics to answer the above research question. (some values in the R output have been deleted deliberately) Carry out an appropriate hypothesis test to answer the research question given above. Q1) What is the appropriate test to answer this question? Refer to the image Q2) What is the null and alternative hypotheses ? Choose one from below - H0: ππ = 0.5, H1:π≠π≠ 0.5


Addition Rule of Probability
It simply refers to the likelihood of an event taking place whenever the occurrence of an event is uncertain. The probability of a single event can be calculated by dividing the number of successful trials of that event by the total number of trials.
Expected Value
When a large number of trials are performed for any random variable ‘X’, the predicted result is most likely the mean of all the outcomes for the random variable and it is known as expected value also known as expectation. The expected value, also known as the expectation, is denoted by: E(X).
Probability Distributions
Understanding probability is necessary to know the probability distributions. In statistics, probability is how the uncertainty of an event is measured. This event can be anything. The most common examples include tossing a coin, rolling a die, or choosing a card. Each of these events has multiple possibilities. Every such possibility is measured with the help of probability. To be more precise, the probability is used for calculating the occurrence of events that may or may not happen. Probability does not give sure results. Unless the probability of any event is 1, the different outcomes may or may not happen in real life, regardless of how less or how more their probability is.
Basic Probability
The simple definition of probability it is a chance of the occurrence of an event. It is defined in numerical form and the probability value is between 0 to 1. The probability value 0 indicates that there is no chance of that event occurring and the probability value 1 indicates that the event will occur. Sum of the probability value must be 1. The probability value is never a negative number. If it happens, then recheck the calculation.
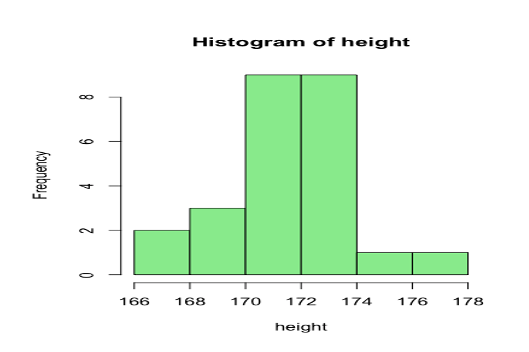
Research Question: Is the average height of basketball players in the club equal to 170cm?
A sample of 25 country club basketball players, height was measured. Use the following graph and Summary Statistics to answer the above research question. (some values in the R output have been deleted deliberately)
Carry out an appropriate hypothesis test to answer the research question given above.
Q1) What is the appropriate test to answer this question? Refer to the image
Q2)
What is the null and alternative hypotheses ? Choose one from below
Q3) What assumption you need to make? Choose one from below
![data: height
t = ????, df =
alternative hypothesis: true mean is not equal to 170
95 percent confidence interval:
170.5682 172.4830
??, p-value
= 0.003096
sample estimates:
mean of x
171.5256
> sd(height)
[1] 2.319408](/v2/_next/image?url=https%3A%2F%2Fcontent.bartleby.com%2Fqna-images%2Fquestion%2Ff8014bf4-f640-4590-bc6d-8654f71afcc2%2F23a9ef31-1d60-4d25-8284-0a9d71e58e47%2Fojpm6iy_processed.png&w=3840&q=75)

Step by step
Solved in 2 steps with 1 images


