it is traditionally believed in the literature on bird migration that godwits that migrate between Alaska and New Zealand travel a mean distance of 11,125 km non-stop. The past several years, more godwits than usual have been observed breeding in the southernmost regions of Alaska. Because of this, a researcher claims the godwits are now traveling a shorter mean distance non-stop. To test this claim, he studied 21 randomly chosen godwits that migrated between Alas and New Zealand. The birds traveled a sample mean distance of 11,045 km non-stop with a sample standard deviation of 345 km. Assume that the population of distances traveled non-stop between Alaska and New Zealand by godwits is approximately normally distributed. Complete the parts below to perform a hypothesis test to see if there is enough evidence, at the 0.10 level of significance, to support that u, the mean distanc godwits travel non-stop between Alaska and New Zealand, is now less than 11,125 km. (a) State the null hypothesis H, and the alternative hypothesis H, that you would use for the test. Ho: I H: I OSO 口と回 口=口
it is traditionally believed in the literature on bird migration that godwits that migrate between Alaska and New Zealand travel a mean distance of 11,125 km non-stop. The past several years, more godwits than usual have been observed breeding in the southernmost regions of Alaska. Because of this, a researcher claims the godwits are now traveling a shorter mean distance non-stop. To test this claim, he studied 21 randomly chosen godwits that migrated between Alas and New Zealand. The birds traveled a sample mean distance of 11,045 km non-stop with a sample standard deviation of 345 km. Assume that the population of distances traveled non-stop between Alaska and New Zealand by godwits is approximately normally distributed. Complete the parts below to perform a hypothesis test to see if there is enough evidence, at the 0.10 level of significance, to support that u, the mean distanc godwits travel non-stop between Alaska and New Zealand, is now less than 11,125 km. (a) State the null hypothesis H, and the alternative hypothesis H, that you would use for the test. Ho: I H: I OSO 口と回 口=口

Holt Mcdougal Larson Pre-algebra: Student Edition 2012
1st Edition
ISBN:9780547587776
Author:HOLT MCDOUGAL
Publisher:HOLT MCDOUGAL
Chapter11: Data Analysis And Probability
Section: Chapter Questions
Problem 8CR

Related questions
Question
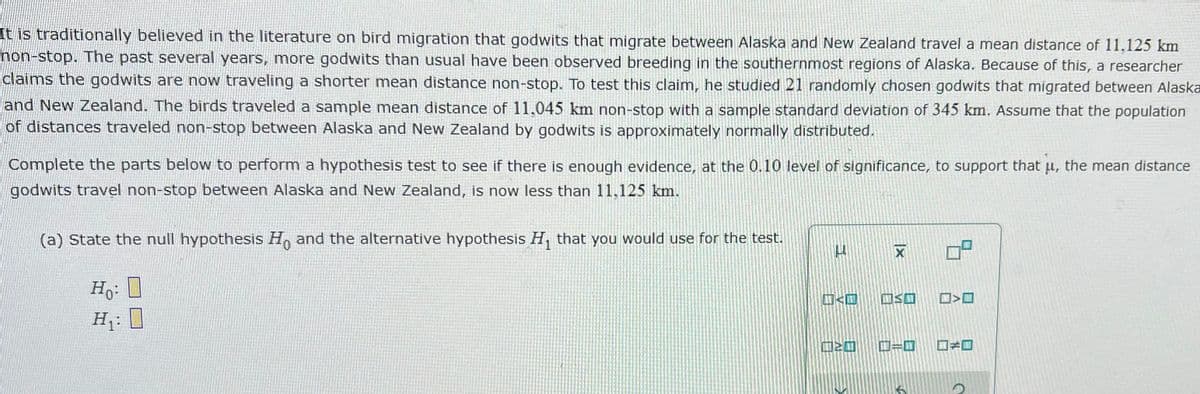
Transcribed Image Text:It is traditionally believed in the literature on bird migration that godwits that migrate between Alaska and New Zealand travel a mean distance of 11,125 km
non-stop. The past several years, more godwits than usual have been observed breeding in the southernmost regions of Alaska. Because of this, a researcher
claims the godwits are now traveling a shorter mean distance non-stop. To test this claim, he studied 21 randomly chosen godwits that migrated between Alaska
and New Zealand. The birds traveled a sample mean distance of 11,045 km non-stop with a sample standard deviation of 345 km. Assume that the population
of distances traveled non-stop between Alaska and New Zealand by godwits is approximately normally distributed.
Complete the parts below to perform a hypothesis test to see if there is enough evidence, at the 0.10 level of significance, to support that u, the mean distance
godwits travel non-stop between Alaska and New Zealand, is now less than 11,125 km.
(a) State the null hypothesis H, and the alternative hypothesis H, that you would use for the test.
Ho: 0
□<ロ
ロSロ
H:
D=D
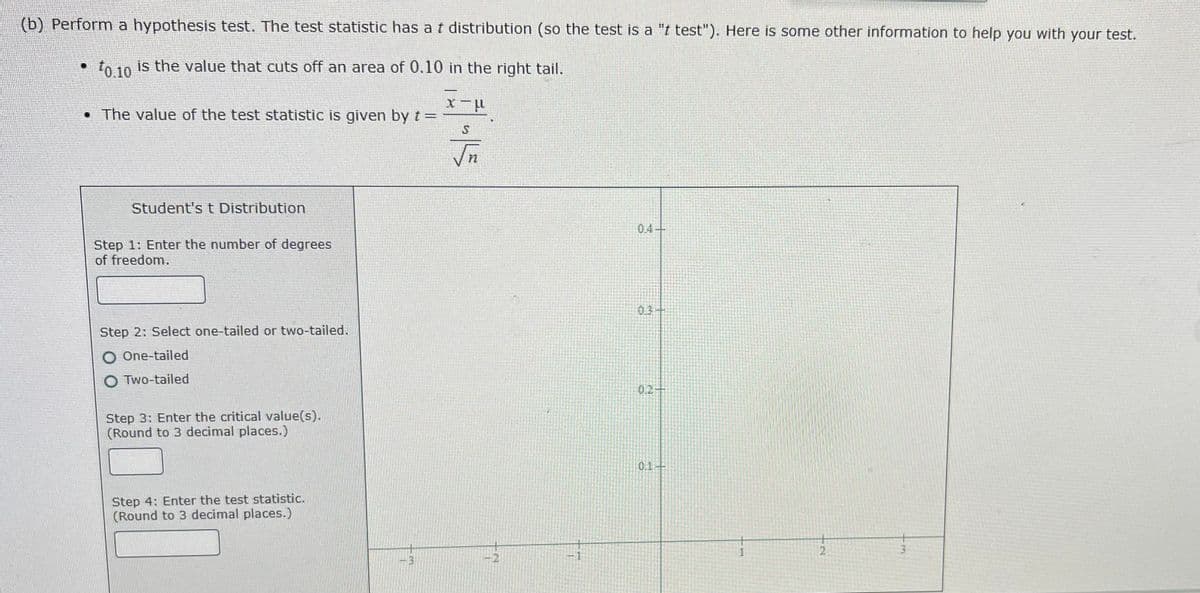
Transcribed Image Text:(b) Perform a hypothesis test. The test statistic has a t distribution (so the test is a "t test"). Here is some other information to help you with your test.
to 10 is the value that cuts off an area of 0.10 in the right tail.
• The value of the test statistic is given by t =
Student's t Distribution
0.4-
Step 1: Enter the number of degrees
of freedom.
0.3+
Step 2: Select one-tailed or two-tailed.
O One-tailed
O Two-tailed
0.2
Step 3: Enter the critical value(s).
(Round to 3 decimal places.)
0.1
Step 4: Enter the test statistic.
(Round to 3 decimal places.)
1
2
3
-2
Expert Solution
This question has been solved!
Explore an expertly crafted, step-by-step solution for a thorough understanding of key concepts.

This is a popular solution!

Trending now
This is a popular solution!

Step by step
Solved in 2 steps with 2 images

Recommended textbooks for you
Holt Mcdougal Larson Pre-algebra: Student Edition…
Algebra
ISBN:
9780547587776
Author:
HOLT MCDOUGAL
Publisher:
HOLT MCDOUGAL


College Algebra (MindTap Course List)
Algebra
ISBN:
9781305652231
Author:
R. David Gustafson, Jeff Hughes
Publisher:
Cengage Learning
Holt Mcdougal Larson Pre-algebra: Student Edition…
Algebra
ISBN:
9780547587776
Author:
HOLT MCDOUGAL
Publisher:
HOLT MCDOUGAL
College Algebra (MindTap Course List)
Algebra
ISBN:
9781305652231
Author:
R. David Gustafson, Jeff Hughes
Publisher:
Cengage Learning