ix samples of each of four types of cereal grain grown in a certain region were analyzed to determine thiamin content, resulting in the following data (µg/g). Wheat 5.3 4.4 6.1 6.1 6.6 5.8 Barley 6.4 8.1 6.2 7.5 5.9 5.6 Maize 5.7 4.8 6.5 5.0 6.1 5.2 Oats 8.2 6.1 7.9 7.1 5.4 7.3 Does this data suggest that at least two of the grains differ with respect to true average thiamin content? Use a level ? = 0.05 test. State the appropriate hypotheses. H0: ?1 ≠ ?2 ≠ ?3 ≠ ?4 Ha: at least two ?i's are equal H0: ?1 = ?2 = ?3 = ?4 Ha: at least two ?i's are unequal H0: ?1 = ?2 = ?3 = ?4 Ha: all four ?i's are unequal H0: ?1 ≠ ?2 ≠ ?3 ≠ ?4 Ha: all four ?i's are equal Compute the test statistic value. (Round your answer to two decimal places.) f = What can be said about the P-value for the test? P-value > 0.100 0.050 < P-value < 0.100 0.010 < P-value < 0.050 0.001 < P-value < 0.010 P-value < 0.001 State the conclusion in the problem context.
ix samples of each of four types of cereal grain grown in a certain region were analyzed to determine thiamin content, resulting in the following data (µg/g). Wheat 5.3 4.4 6.1 6.1 6.6 5.8 Barley 6.4 8.1 6.2 7.5 5.9 5.6 Maize 5.7 4.8 6.5 5.0 6.1 5.2 Oats 8.2 6.1 7.9 7.1 5.4 7.3 Does this data suggest that at least two of the grains differ with respect to true average thiamin content? Use a level ? = 0.05 test. State the appropriate hypotheses. H0: ?1 ≠ ?2 ≠ ?3 ≠ ?4 Ha: at least two ?i's are equal H0: ?1 = ?2 = ?3 = ?4 Ha: at least two ?i's are unequal H0: ?1 = ?2 = ?3 = ?4 Ha: all four ?i's are unequal H0: ?1 ≠ ?2 ≠ ?3 ≠ ?4 Ha: all four ?i's are equal Compute the test statistic value. (Round your answer to two decimal places.) f = What can be said about the P-value for the test? P-value > 0.100 0.050 < P-value < 0.100 0.010 < P-value < 0.050 0.001 < P-value < 0.010 P-value < 0.001 State the conclusion in the problem context.

Mathematics For Machine Technology
8th Edition
ISBN:9781337798310
Author:Peterson, John.
Publisher:Peterson, John.
Chapter29: Tolerance, Clearance, And Interference
Section: Chapter Questions
Problem 16A: Spacers are manufactured to the mean dimension and tolerance shown in Figure 29-12. An inspector...

Related questions
Question
100%
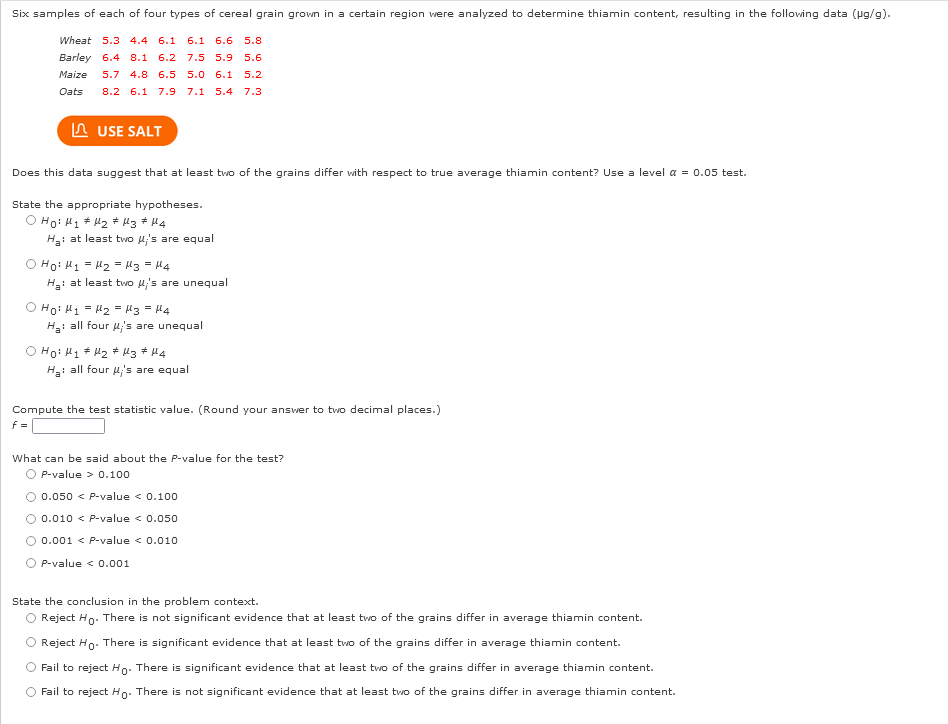
Six samples of each of four types of cereal grain grown in a certain region were analyzed to determine thiamin content, resulting in the following data (µg/g).
| Wheat | 5.3 | 4.4 | 6.1 | 6.1 | 6.6 | 5.8 |
| Barley | 6.4 | 8.1 | 6.2 | 7.5 | 5.9 | 5.6 |
| Maize | 5.7 | 4.8 | 6.5 | 5.0 | 6.1 | 5.2 |
| Oats | 8.2 | 6.1 | 7.9 | 7.1 | 5.4 | 7.3 |
Does this data suggest that at least two of the grains differ with respect to true average thiamin content? Use a level ? = 0.05 test.
State the appropriate hypotheses.
H0: ?1 ≠ ?2 ≠ ?3 ≠ ?4
Ha: at least two ?i's are equal H0: ?1 = ?2 = ?3 = ?4
Ha: at least two ?i's are unequal H0: ?1 = ?2 = ?3 = ?4
Ha: all four ?i's are unequal H0: ?1 ≠ ?2 ≠ ?3 ≠ ?4
Ha: all four ?i's are equal
Ha: at least two ?i's are equal H0: ?1 = ?2 = ?3 = ?4
Ha: at least two ?i's are unequal H0: ?1 = ?2 = ?3 = ?4
Ha: all four ?i's are unequal H0: ?1 ≠ ?2 ≠ ?3 ≠ ?4
Ha: all four ?i's are equal
Compute the test statistic value. (Round your answer to two decimal places.)
f =
What can be said about the P-value for the test?
P-value > 0.100 0.050 < P-value < 0.100 0.010 < P-value < 0.050 0.001 < P-value < 0.010 P-value < 0.001
State the conclusion in the problem context.
Reject H0. There is not significant evidence that at least two of the grains differ in average thiamin content. Reject H0. There is significant evidence that at least two of the grains differ in average thiamin content. Fail to reject H0. There is significant evidence that at least two of the grains differ in average thiamin content. Fail to reject H0. There is not significant evidence that at least two of the grains differ in average thiamin content.
Transcribed Image Text:Six samples of each of four types of cereal grain grown in a certain region were analyzed to determine thiamin content, resulting in the following data (µg/g).
Wheat 5.3 4.4 6.1 6.1 6.6 5.8.
Barley 6.4 8.1 6.2 7.5 5.9 5.6
5.0 6.1 5.2
Maize 5.7 4.8 6.5
Oats
8.2 6.1 7.9 7.1 5.4 7.3
USE SALT
Does this data suggest that at least two of the grains differ with respect to true average thiamin content? Use a level α = 0.05 test.
State the appropriate hypotheses.
оно му #Мафиз Ана
H₂: at least two μ's are equal
O Ho: M₁ = M₂ = μ3 = 14
Ha: at least two μ's are unequal
о ном1 = М2 = 3 = 14
H₂: all four μ's are unequal
O Hoi H₁ H₂ H3 # M4
H₂: all four μ's are equal
Compute the test statistic value. (Round your answer to two decimal places.)
f=
What can be said about the P-value for the test?
O P-value > 0.100
0.050 < P-value < 0.100
○ 0.010 < P-value < 0.050
0.001 < P-value < 0.010
P-value < 0.001
State the conclusion in the problem context.
O Reject Ho. There is not significant evidence that at least two of the grains differ in average thiamin content.
Reject Ho. There is significant evidence that at least two of the grains differ in average thiamin content.
Fail to reject Ho. There is significant evidence that at least two of the grains differ in average thiamin content.
Fail to reject Ho. There is not significant evidence that at least two of the grains differ in average thiamin content.
Expert Solution
This question has been solved!
Explore an expertly crafted, step-by-step solution for a thorough understanding of key concepts.

This is a popular solution!

Trending now
This is a popular solution!

Step by step
Solved in 3 steps with 3 images

Recommended textbooks for you
Mathematics For Machine Technology
Advanced Math
ISBN:
9781337798310
Author:
Peterson, John.
Publisher:
Cengage Learning,

Glencoe Algebra 1, Student Edition, 9780079039897…
Algebra
ISBN:
9780079039897
Author:
Carter
Publisher:
McGraw Hill
Mathematics For Machine Technology
Advanced Math
ISBN:
9781337798310
Author:
Peterson, John.
Publisher:
Cengage Learning,
Glencoe Algebra 1, Student Edition, 9780079039897…
Algebra
ISBN:
9780079039897
Author:
Carter
Publisher:
McGraw Hill