Jamie Wong is thinking of building an investment portfolio containing two stocks, Land M. Stock L will represent 44% of the dollar value of the portfolio, and stock M will account for the other 56%. The historical returns over the last 6 years, 2013-2018, for each of these stocks are shown in the following table 4. a. Calculate the actual portfolio return, rp, for each of the 6 years. b. Calculate the average return for each stock and for the portfolio over the 6-year period.
Jamie Wong is thinking of building an investment portfolio containing two stocks, Land M. Stock L will represent 44% of the dollar value of the portfolio, and stock M will account for the other 56%. The historical returns over the last 6 years, 2013-2018, for each of these stocks are shown in the following table 4. a. Calculate the actual portfolio return, rp, for each of the 6 years. b. Calculate the average return for each stock and for the portfolio over the 6-year period.

Intermediate Financial Management (MindTap Course List)
13th Edition
ISBN:9781337395083
Author:Eugene F. Brigham, Phillip R. Daves
Publisher:Eugene F. Brigham, Phillip R. Daves
Chapter2: Risk And Return: Part I
Section: Chapter Questions
Problem 13P

Related questions
Question
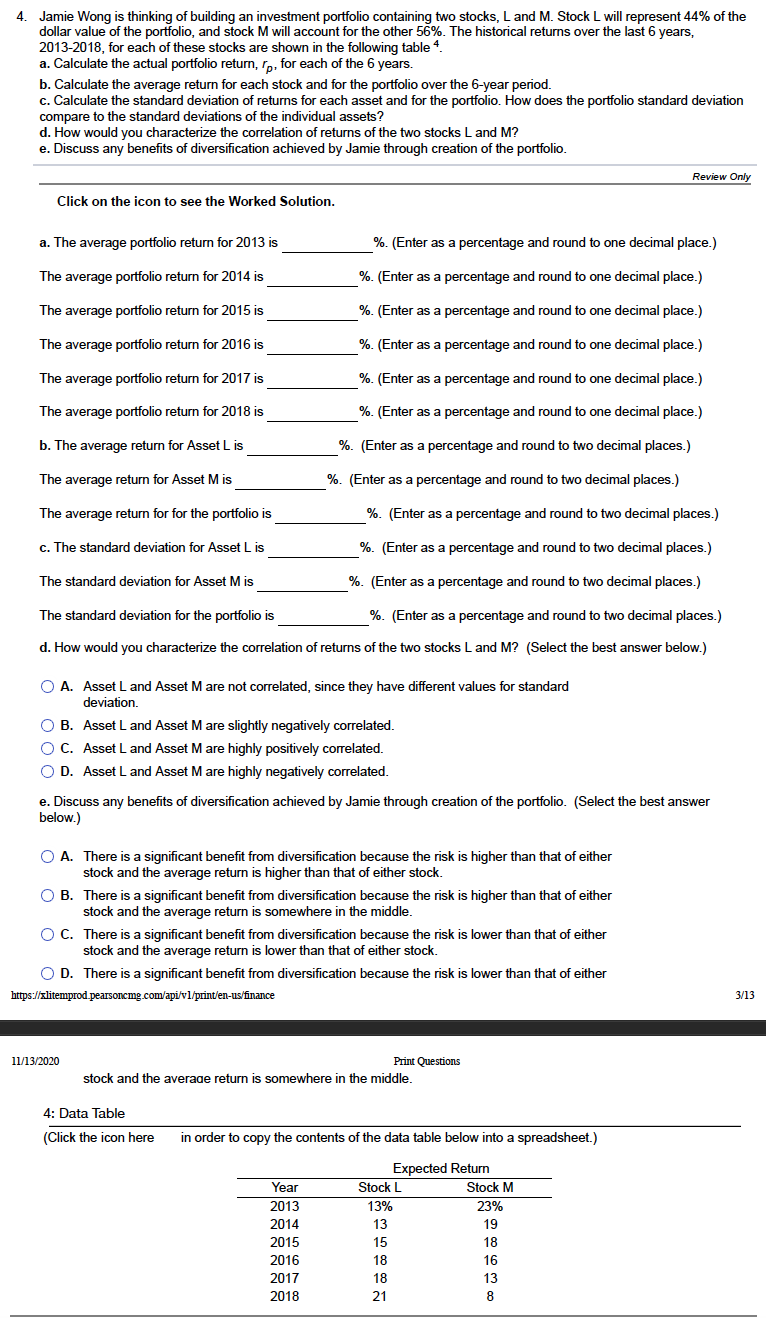
Transcribed Image Text:4. Jamie Wong is thinking of building an investment portfolio containing two stocks, L and M. Stock L will represent 44% of the
dollar value of the portfolio, and stock M will account for the other 56%. The historical returns over the last 6 years,
2013-2018, for each of these stocks are shown in the following table 4.
a. Calculate the actual portfolio return, r,, for each of the 6 years.
b. Calculate the average return for each stock and for the portfolio over the 6-year period.
c. Calculate the standard deviation of returns for each asset and for the portfolio. How does the portfolio standard deviation
compare to the standard deviations of the individual assets?
d. How would you characterize the correlation of returns of the two stocks L and M?
e. Discuss any benefits of diversification achieved by Jamie through creation of the portfolio.
Review Only
Click on the icon to see the Worked Solution.
a. The average portfolio return for 2013 is
%. (Enter as a percentage and round to one decimal place.)
The average portfolio return for 2014 is
%. (Enter as a percentage and round to one decimal place.)
The average portfolio return for 2015 is
%. (Enter as a percentage and round to one decimal place.)
The average portfolio return for 2016 is
%. (Enter as a percentage and round to one decimal place.)
The average portfolio return for 2017 is
%. (Enter as a percentage and round to one decimal place.)
The average portfolio return for 2018 is
%. (Enter as a percentage and round to one decimal place.)
b. The average return for Asset L is
%. (Enter as a percentage and round to two decimal places.)
The average return for Asset M is
%. (Enter as a percentage and round to two decimal places.)
The average return for for the portfolio is
%. (Enter as a percentage and round to two decimal places.)
c. The standard deviation for Asset L is
%. (Enter as a percentage and round to two decimal places.)
The standard deviation for Asset M is
%. (Enter as a percentage and round to two decimal places.)
The standard deviation for the portfolio is
%. (Enter as a percentage and round to two decimal places.)
d. How would you characterize the correlation of returns of the two stocks L and M? (Select the best answer below.)
O A. Asset L and Asset Mare not correlated, since they have different values for standard
deviation.
O B. Asset L and Asset M are slightly negatively correlated.
O C. Asset L and Asset M are highly positively correlated.
O D. Asset L and Asset M are highly negatively correlated.
e. Discuss any benefits of diversification achieved by Jamie through creation of the portfolio. (Select the best answer
below.)
O A. There is a significant benefit from diversification because the risk is higher than that of either
stock and the average return is higher than that of either stock.
O B. There is a significant benefit from diversification because the risk is higher than that of either
stock and the average return is somewhere in the middle.
O C. There is a significant benefit from diversification because the risk is lower than that of either
stock and the average return is lower than that of either stock,
O D. There is a significant benefit from diversification because the risk i
lower than that of either
https://xlitemprod.pearsoncmg.com/api/vl/print/en-us/finance
3/13
11/13/2020
Print Questions
stock and the average return
somewhere in the middle.
4: Data Table
(Click the icon here
in order to copy the contents of the data table below into a spreadsheet.)
Expected Return
Year
Stock L
Stock M
2013
13%
23%
2014
13
19
2015
15
18
2016
18
16
2017
18
13
2018
21
8
Expert Solution
This question has been solved!
Explore an expertly crafted, step-by-step solution for a thorough understanding of key concepts.

This is a popular solution!

Trending now
This is a popular solution!

Step by step
Solved in 3 steps

Knowledge Booster


Learn more about
Need a deep-dive on the concept behind this application? Look no further. Learn more about this topic, finance and related others by exploring similar questions and additional content below.Recommended textbooks for you
Intermediate Financial Management (MindTap Course…
Finance
ISBN:
9781337395083
Author:
Eugene F. Brigham, Phillip R. Daves
Publisher:
Cengage Learning

EBK CONTEMPORARY FINANCIAL MANAGEMENT
Finance
ISBN:
9781337514835
Author:
MOYER
Publisher:
CENGAGE LEARNING - CONSIGNMENT

Pfin (with Mindtap, 1 Term Printed Access Card) (…
Finance
ISBN:
9780357033609
Author:
Randall Billingsley, Lawrence J. Gitman, Michael D. Joehnk
Publisher:
Cengage Learning
Intermediate Financial Management (MindTap Course…
Finance
ISBN:
9781337395083
Author:
Eugene F. Brigham, Phillip R. Daves
Publisher:
Cengage Learning
EBK CONTEMPORARY FINANCIAL MANAGEMENT
Finance
ISBN:
9781337514835
Author:
MOYER
Publisher:
CENGAGE LEARNING - CONSIGNMENT
Pfin (with Mindtap, 1 Term Printed Access Card) (…
Finance
ISBN:
9780357033609
Author:
Randall Billingsley, Lawrence J. Gitman, Michael D. Joehnk
Publisher:
Cengage Learning

