Your portfolio had the values in the following table for the four years listed: 1. a. Calculate your return for each year over the 4-year period. Then calculate the average return over the 4-year period. b. Calculate the portfolio standard deviation. Revie Click the icon to see the Worked Solution. The return for 2016 is %. (Round to two decimal places.) The return for 2017 is %. (Round to two decimal places.) The return for 2018 is %. (Round to two decimal places.) The return for 2019 is %. (Round to two decimal places.)
Your portfolio had the values in the following table for the four years listed: 1. a. Calculate your return for each year over the 4-year period. Then calculate the average return over the 4-year period. b. Calculate the portfolio standard deviation. Revie Click the icon to see the Worked Solution. The return for 2016 is %. (Round to two decimal places.) The return for 2017 is %. (Round to two decimal places.) The return for 2018 is %. (Round to two decimal places.) The return for 2019 is %. (Round to two decimal places.)

Intermediate Financial Management (MindTap Course List)
13th Edition
ISBN:9781337395083
Author:Eugene F. Brigham, Phillip R. Daves
Publisher:Eugene F. Brigham, Phillip R. Daves
Chapter2: Risk And Return: Part I
Section: Chapter Questions
Problem 13P

Related questions
Question
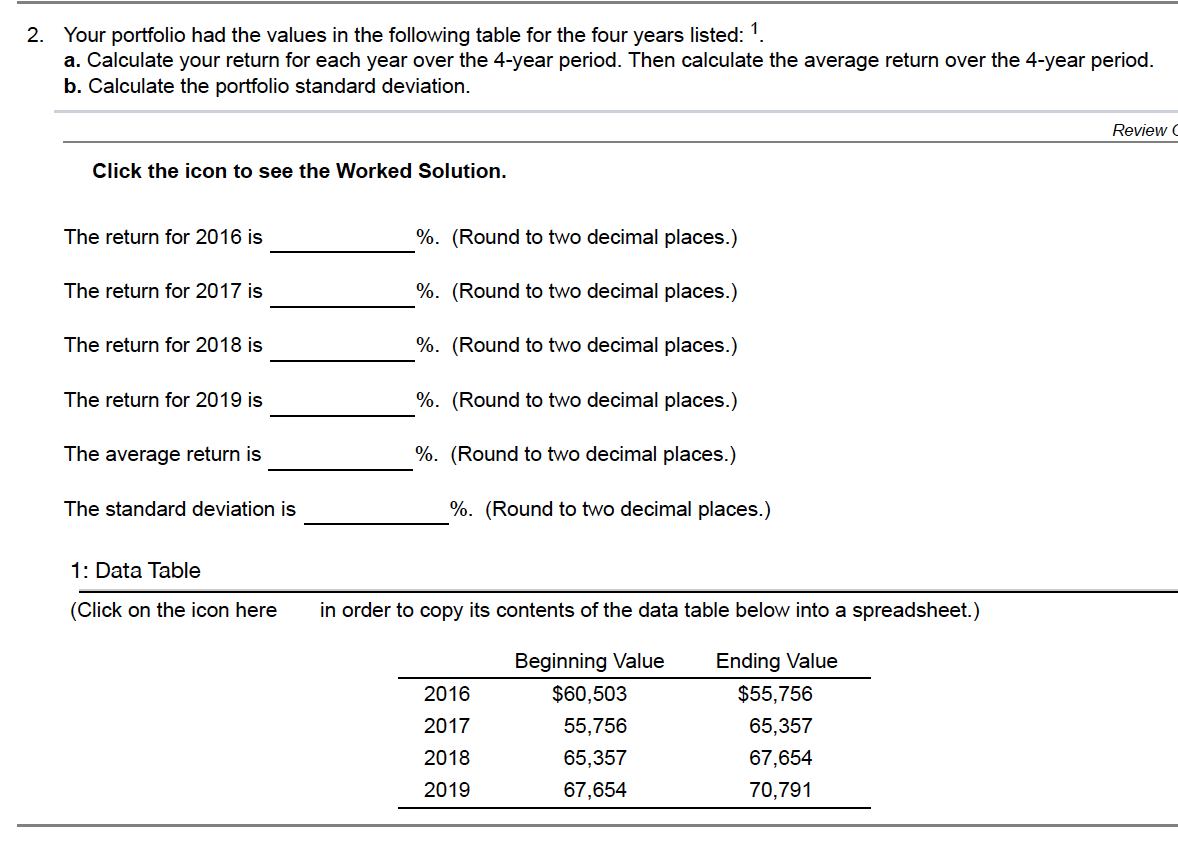
Transcribed Image Text:2. Your portfolio had the values in the following table for the four years listed: 1.
a. Calculate your return for each year over the 4-year period. Then calculate the average return over the 4-year period.
b. Calculate the portfolio standard deviation.
Review C
Click the icon to see the Worked Solution.
The return for 2016 is
%. (Round to two decimal places.)
The return for 2017 is
%. (Round to two decimal places.)
The return for 2018 is
%. (Round to two decimal places.)
The return for 2019 is
%. (Round to two decimal places.)
The average return is
%. (Round to two decimal places.)
The standard deviation is
%. (Round to two decimal places.)
1: Data Table
(Click on the icon here
in order to copy its contents of the data table below into a spreadsheet.)
Beginning Value
Ending Value
2016
$60,503
$55,756
2017
55,756
65,357
2018
65,357
67,654
2019
67,654
70,791
Expert Solution
This question has been solved!
Explore an expertly crafted, step-by-step solution for a thorough understanding of key concepts.

This is a popular solution!

Trending now
This is a popular solution!

Step by step
Solved in 2 steps with 3 images

Knowledge Booster


Learn more about
Need a deep-dive on the concept behind this application? Look no further. Learn more about this topic, finance and related others by exploring similar questions and additional content below.Recommended textbooks for you
Intermediate Financial Management (MindTap Course…
Finance
ISBN:
9781337395083
Author:
Eugene F. Brigham, Phillip R. Daves
Publisher:
Cengage Learning

EBK CONTEMPORARY FINANCIAL MANAGEMENT
Finance
ISBN:
9781337514835
Author:
MOYER
Publisher:
CENGAGE LEARNING - CONSIGNMENT

Essentials of Business Analytics (MindTap Course …
Statistics
ISBN:
9781305627734
Author:
Jeffrey D. Camm, James J. Cochran, Michael J. Fry, Jeffrey W. Ohlmann, David R. Anderson
Publisher:
Cengage Learning
Intermediate Financial Management (MindTap Course…
Finance
ISBN:
9781337395083
Author:
Eugene F. Brigham, Phillip R. Daves
Publisher:
Cengage Learning
EBK CONTEMPORARY FINANCIAL MANAGEMENT
Finance
ISBN:
9781337514835
Author:
MOYER
Publisher:
CENGAGE LEARNING - CONSIGNMENT
Essentials of Business Analytics (MindTap Course …
Statistics
ISBN:
9781305627734
Author:
Jeffrey D. Camm, James J. Cochran, Michael J. Fry, Jeffrey W. Ohlmann, David R. Anderson
Publisher:
Cengage Learning