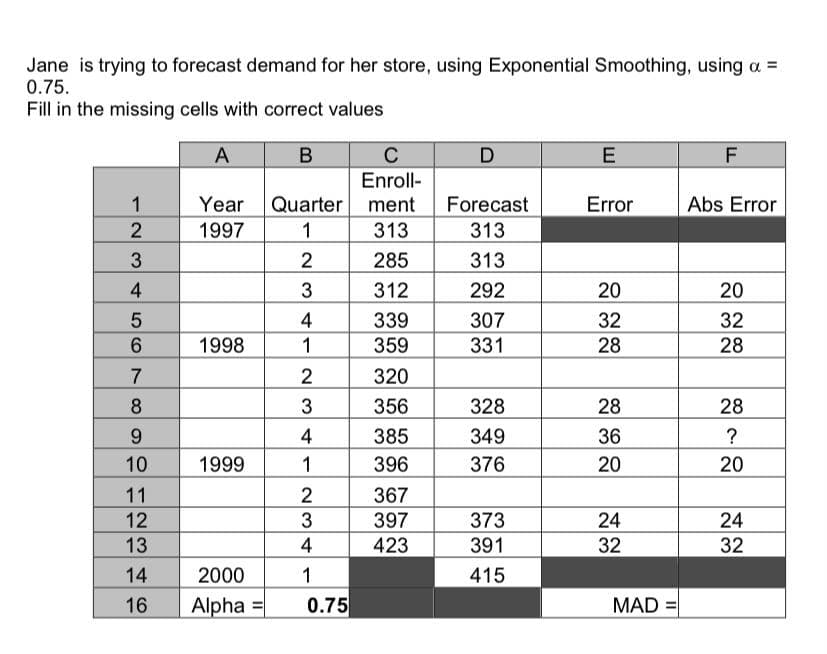
Jane is trying to forecast demand for her store, using Exponential Smoothing, using a = 0.75. Fill in the missing cells with correct values


Q: You want to determine the control lines for a "p" chart for quality control purposes. If the total…
A: Answer = 0.04841
Q: The proper human resource management for strategic execution is a foundational block on which…
A: Strategic human resource management often called SHRM can be stated as the approach of…
Q: misunderstanding between customers and designers
A: In This Step I will Explain the causes of misunderstanding between Designers and Customers, and the…
Q: Drawthe budget constraint for a consumer with standard preferences.
A: For the First Part here is the solution: If the consumer had an income of $3,000 and the cost of…
Q: QUESTION 2 a) b) Ferrero Candy Company makes three types of candy, which are solid, fruit and cream-…
A: Note: - As both the questions are not related to each other, we will answer the first question here.…
Q: 1. Explain and present an example of how decision analysis can be used in determining optimal…
A: Decision analysis is primarily used to develop optimal strategy when the decision making team is…
Q: (a) (b) State the optimal delivery plan and cost. Contactgear must change couriers for the Selangor…
A: The transportation model is used to calculate the minimum cost of the route by selecting different…
Q: Consider a firm planning to start a new venture of manufacturing area. Discuss the points for…
A: Here, as per the question, a firm is planning to start a new venture in the manufacturing area or…
Q: What is the relation between Quality Assurance (QA), Quality Control (QC) and GMP
A: As per FDA a drug is defined as adulterated if the methodologies utilized in its production/…
Q: Companies A, B, C were evaluated as prospective suppliers of timber to a furniture manufacturing…
A:
Q: A B C D − 480 500 50 350 − 175 0 0 0 − 750 0 0 0 −…
A: Work centers is a common word used in operations management where people are employed for performing…
Q: Describe several collaboration tools and how they might be used to improve project communications.…
A: Project collaboration tools help the project teams to coordinate, communicate, and execute their job…
Q: The company Marombeiro is a commercial representative of a food supplement widely consumed in gyms.…
A: Safety stock is the amount of goods kept in inventory as a backup against delivery failures, over…
Q: The value chain includes research and development, customer service, marketing, and suppliers. True…
A: A value chain can be stated as the business model that defines the full range of tasks required to…
Q: Muir Manufacturing produces two popular grades of commercial carpeting among its many other…
A: Objective Functions and Constraints: Based on the given details, the objective…
Q: Inside an organization, enterprise resource planning (ERP) is related to: a. Manufacturing only.…
A: Operations management is described as a business and administrative practice that allow a business…
Q: Give some of the essential issues in the office layout. Discuss each.
A: Office layout:- Your company's corporate statement is reflected in your office layout. More than…
Q: Machinists who work at a tool-and-die plant must check out tools from a tool center. An average of…
A:
Q: A 10-hectare parcel of land is zoned for building densities of 6 detached houses per hectare, 8…
A: Given data is Available land = 10 hectare Number of houses to build = 6 Number of duplex units to…
Q: Who is person name, company, and decade, Six Sigma was a registered trademark?
A: Six sigma:- The Six Sigma methodology gives businesses the tools they need to strengthen the…
Q: b. The Healthy Food Restaurant, a 24-hour restaurant, faces changing requirements from hour to hour.…
A: First hour principle - Enough workers are assigned to start their shift as needed in the first…
Q: Joe Henry's machine shop uses 2,490 brackets during the course of a year. These brackets are…
A: Companies determine their optimal order size by performing a calculation known as the economic order…
Q: A supply chain strategy involves decisions on all of the following except: ( )Inventory; (…
A: SCM is a strategic approach to integrating supply and demand in the market. It involves several…
Q: The economic purchase lot is an important tool for companies that want to minimize the total cost of…
A: Economic purchase lot or economic order quantity is a mathematical concept used in operations to…
Q: Product X is made of 2 units of Y and 3 of Z. Y is made of 1 unit of A and 2 units of B. Z is made…
A: Lot for lot is used for all components except Y and C. The minimum unit requirements for Y and C is…
Q: b. How many drives should be carried as a safety stock? c. What is the appropriate reorder point? K…
A: Given data: Demand during lead time = 46 units Standard deviation(σ) = 6 Service Level = 90%
Q: locations while accounting for small local variations. Which strategy is your organization following…
A: Nowadays, globalization in combination with a greater degree of interconnections between persons…
Q: Use the technique developed in this section to solve the minimization problem. Minimize C = 10x + y…
A: Objective Functions: Minimize C= 10 x+ y Constraints: Subject to- 4x+y≥24 (Constraint 1)…
Q: ct schedules and how do we decide what
A: Tools and methodologies for scheduling Project schedules may be developed, monitored, and controlled…
Q: Question 3.1 Kim's Convenience store has a variable demand. On a given day, demand ranges from…
A: Customer satisfaction may be positively or negatively impacted by your order cycle time. An extended…
Q: 3. Cynthia Knott’s oyster bar buys fresh Louisiana oysters for $5 per pound and sells them for…
A: Note: - For a multiple subparts question we can answer only up to three subparts. So we will answer…
Q: Study the screenshot above. The tabs Pivotlable Analyze and Design, are not ordinarily visible. What…
A: The tabs PivotTable Analyze and Design
Q: Explain, in some detail, the significance of the phrase "Science X Art" as it relates to the attempt…
A: The phrase here can be read as "Science and Art". This phrase signifies the nature of the work to be…
Q: Draw the network diagram based on the information given below. Calculate the ES, EF, LS, LF and…
A: Using the details given in the table, the following network diagram can be prepared.
Q: Given the following forecast and cost information, determine Production Costs the total cost of a…
A: Total cost = regular cost+overtime cost+subcontracting cost Given regular cost 50 overtime…
Q: Inventory items that belong in the A category include ________.
A: The ABC analysis is the technique of inventory management that is used to identify the value of…
Q: Complete the forecasting worksheets for: Naïve Average Moving Average Weighted Moving Average…
A: Weighted Moving Average using the weights of .8, .15, and .05 ExponA using and an alpha level of .75…
Q: Explain in your own words at least 3 important reasons why need to study Productions and Operations…
A: Operations management can be broadly defined as an approach the involves the understanding of nature…
Q: The project manager or his designees should review the documents that authorise the project and…
A: A statement of work(SOW) is a document that will include the details about the contract such as what…
Q: Choose any step from the entrepreneurial process and describe and elaborate on why you think it is…
A: Entrepreneurs are those people that are running their own business efficiently and generating big…
Q: Describe three situations in which a purchaser might select a supplier that is having financial…
A: Supplier:- An entity that offers goods or services to another entity is known as a supplier. One…
Q: Discuss in detail the benefits and drawbacks for just in time (jit) inventory
A: To be determined: The benefits and drawbacks for just in time (jit) inventory. Introduction: A…
Q: In the same interview, you are asked to briefly discuss the following information: What is the…
A: The manufacturing environment is based on the industrial functional facilities to manufacture…
Q: Q.1.2. Using a suitable example for each, describe any three factors that could constrain a project.…
A: 1.2 A project's constraints and dangers are referred to as its constraints and dangers. In the end,…
Q: a) Table 2a below illustrates the tasks to be performed for the delivery of a new software package.…
A: Note: - Since we can answer only up to three subparts we will answer the first three subparts(i,…
Q: If the reliability of each and every component shown in R1, R2, R3, R4 and R5 are reduced by 15%…
A: Ans) We need to solve the solved problem 17.2 using new reliabilities. the reliability of each and…
Q: Chicago's Hard Rock Hotel distributes a mean of 1,200 bath towels per day to guests at the pool and…
A: Average daily demand, AVG =1200 bath towels per day Standard deviation, STD =100 towels per day Lead…
Q: Suppose you are a project manager of a power plant project and there is a penalty in your contract…
A: Based on the above case, I would list all the possible decisions, then, I would prepare the decision…
Q: w the optimal shipping plan. ipping cost is $. (Enter your response as a whole number) More Info…
A: Ans) We will assign a very large cost to warehouse 3 city 4 , so it cannot transport. Sum of…
Q: The element that differentiates between one-way communication and two-ways communication is? A.…
A: Communication in simple terms is the transfer of information or data between two or more people. It…
Jane is trying to
Fill in the missing cells with correct values

Step by step
Solved in 3 steps with 2 images

- The Baker Company wants to develop a budget to predict how overhead costs vary with activity levels. Management is trying to decide whether direct labor hours (DLH) or units produced is the better measure of activity for the firm. Monthly data for the preceding 24 months appear in the file P13_40.xlsx. Use regression analysis to determine which measure, DLH or Units (or both), should be used for the budget. How would the regression equation be used to obtain the budget for the firms overhead costs?The file P13_42.xlsx contains monthly data on consumer revolving credit (in millions of dollars) through credit unions. a. Use these data to forecast consumer revolving credit through credit unions for the next 12 months. Do it in two ways. First, fit an exponential trend to the series. Second, use Holts method with optimized smoothing constants. b. Which of these two methods appears to provide the best forecasts? Answer by comparing their MAPE values.The owner of a restaurant in Bloomington, Indiana, has recorded sales data for the past 19 years. He has also recorded data on potentially relevant variables. The data are listed in the file P13_17.xlsx. a. Estimate a simple regression equation involving annual sales (the dependent variable) and the size of the population residing within 10 miles of the restaurant (the explanatory variable). Interpret R-square for this regression. b. Add another explanatory variableannual advertising expendituresto the regression equation in part a. Estimate and interpret this expanded equation. How does the R-square value for this multiple regression equation compare to that of the simple regression equation estimated in part a? Explain any difference between the two R-square values. How can you use the adjusted R-squares for a comparison of the two equations? c. Add one more explanatory variable to the multiple regression equation estimated in part b. In particular, estimate and interpret the coefficients of a multiple regression equation that includes the previous years advertising expenditure. How does the inclusion of this third explanatory variable affect the R-square, compared to the corresponding values for the equation of part b? Explain any changes in this value. What does the adjusted R-square for the new equation tell you?
- The file P13_26.xlsx contains the monthly number of airline tickets sold by the CareFree Travel Agency. a. Create a time series chart of the data. Based on what you see, which of the exponential smoothing models do you think will provide the best forecasting model? Why? b. Use simple exponential smoothing to forecast these data, using a smoothing constant of 0.1. c. Repeat part b, but search for the smoothing constant that makes RMSE as small as possible. Does it make much of an improvement over the model in part b?The file P13_22.xlsx contains total monthly U.S. retail sales data. While holding out the final six months of observations for validation purposes, use the method of moving averages with a carefully chosen span to forecast U.S. retail sales in the next year. Comment on the performance of your model. What makes this time series more challenging to forecast?The file P13_02.xlsx contains five years of monthly data on sales (number of units sold) for a particular company. The company suspects that except for random noise, its sales are growing by a constant percentage each month and will continue to do so for at least the near future. a. Explain briefly whether the plot of the series visually supports the companys suspicion. b. By what percentage are sales increasing each month? c. What is the MAPE for the forecast model in part b? In words, what does it measure? Considering its magnitude, does the model seem to be doing a good job? d. In words, how does the model make forecasts for future months? Specifically, given the forecast value for the last month in the data set, what simple arithmetic could you use to obtain forecasts for the next few months?
- The file P13_29.xlsx contains monthly time series data for total U.S. retail sales of building materials (which includes retail sales of building materials, hardware and garden supply stores, and mobile home dealers). a. Is seasonality present in these data? If so, characterize the seasonality pattern. b. Use Winters method to forecast this series with smoothing constants = = 0.1 and = 0.3. Does the forecast series seem to track the seasonal pattern well? What are your forecasts for the next 12 months?The file P13_28.xlsx contains monthly retail sales of U.S. liquor stores. a. Is seasonality present in these data? If so, characterize the seasonality pattern. b. Use Winters method to forecast this series with smoothing constants = = 0.1 and = 0.3. Does the forecast series seem to track the seasonal pattern well? What are your forecasts for the next 12 months?A small computer chip manufacturer wants to forecast monthly ozperating costs as a function of the number of units produced during a month. The company has collected the 16 months of data in the file P13_34.xlsx. a. Determine an equation that can be used to predict monthly production costs from units produced. Are there any outliers? b. How could the regression line obtained in part a be used to determine whether the company was efficient or inefficient during any particular month?
- Do the sales prices of houses in a given community vary systematically with their sizes (as measured in square feet)? Answer this question by estimating a simple regression equation where the sales price of the house is the dependent variable, and the size of the house is the explanatory variable. Use the sample data given in P13_06.xlsx. Interpret your estimated equation, the associated R-square value, and the associated standard error of estimate.The file P13_25.xlsx contains the quarterly numbers of applications for home mortgage loans at a branch office of Northern Central Bank. a. Create a time series chart of the data. Based on what you see, which of the exponential smoothing models do you think will provide the best forecasting model? Why? b. Use simple exponential smoothing to forecast these data, using a smoothing constant of 0.1. c. Repeat part b, but search for the smoothing constant that makes RMSE as small as possible. Does it make much of an improvement over the model in part b? Is it guaranteed to produce better forecasts for the future?Suppose that a regional express delivery service company wants to estimate the cost of shipping a package (Y) as a function of cargo type, where cargo type includes the following possibilities: fragile, semifragile, and durable. Costs for 15 randomly chosen packages of approximately the same weight and same distance shipped, but of different cargo types, are provided in the file P13_16.xlsx. a. Estimate a regression equation using the given sample data, and interpret the estimated regression coefficients. b. According to the estimated regression equation, which cargo type is the most costly to ship? Which cargo type is the least costly to ship? c. How well does the estimated equation fit the given sample data? How might the fit be improved? d. Given the estimated regression equation, predict the cost of shipping a package with semifragile cargo.

