John drives to work each morning, and the trip takes an average of u = 38 minutes. The distribution of driving times is approximately normal with a standard deviation of o = 5 minutes. For a randomly selected morning, what is the probability that John's drive to work will take less than 35 minutes?
John drives to work each morning, and the trip takes an average of u = 38 minutes. The distribution of driving times is approximately normal with a standard deviation of o = 5 minutes. For a randomly selected morning, what is the probability that John's drive to work will take less than 35 minutes?

MATLAB: An Introduction with Applications
6th Edition
ISBN:9781119256830
Author:Amos Gilat
Publisher:Amos Gilat
Chapter1: Starting With Matlab
Section: Chapter Questions
Problem 1P

Related questions
Question
Note: Use the image of table provided
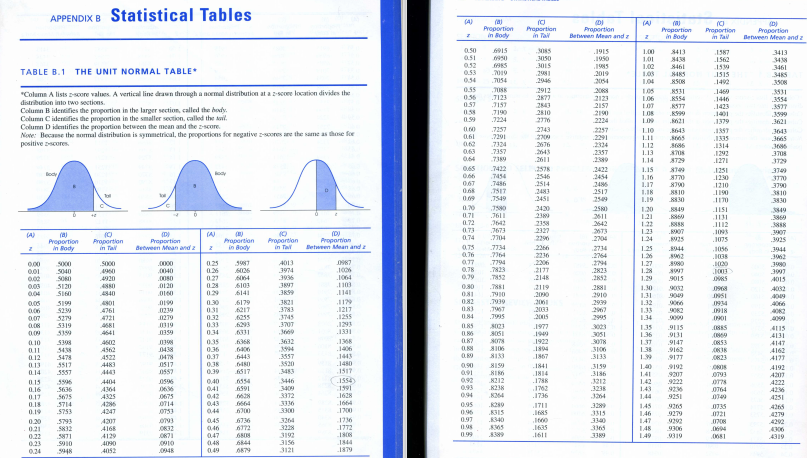
Transcribed Image Text:APPENDIX B Statistical Tables
(A)
(a)
Proportion
in Body
(A
Proportion
in Ta
Proportion
Between Mean and z
Proportion
in Body
Proportion
in Tail
(D)
Proportion
Between Mean and z
0.50
051
6915
3085
3050
3015
.1915
1.00
3413
1587
3413
1950
.1950
1985
2019
348
1.01
1.00
1562
1539
1515
1492
0.52
8461
TABLE B.1 THE UNIT NORMAL TABLE
3461
3485
0.53
2019
1.03
L04
S485
8508
7054
2946
2054
3508
0.55
7088
7123
J157
2912
2877
2068
105
L06
8531
RS54
1469
"Column A lists zsoore vales. A venical line deaun through a nomal distribution at a 2scone location divides the
distribution into two sections.
0.36
0.57
2123
2157
2190
3531
3554
3577
1446
.1423
2843
2810
8S77
Column B identifies the proportion in the larger section, called the hody.
Column Cidentifies the proportion in the smaller section, called the Avil.
Column D identifies the proportion between the mean and the z-score.
Note: Because the nomal distribation is symmetrical, the proportions for negative z-ores e the same as those for
positive zscores
7190
7224
LOS
3999
0.99
224
2257
2291
1379
0.00
7257
7201
7124
2743
LIO
LII
8643
.1357
3643
3665
061
1335
1314
0,63
0.64
276
2643
2611
2324
237
2389
L12
1.13
3686
370
7357
1292
1271
7389
1.14
3729
3729
0.65
0.66
7422
2578
2546
2514
2422
1.15
1251
1230
3749
lody
.7454
0.67
068
2454
2486
2517
1.16
1.17
8770
8790
1210
J190
3770
3790
3810
2483
2451
L18
L19
8810
8830
0.09
7549
259
3830
0.20
0.71
0.72
2430
2580
1.20
121
8849
3349
3869
J611
J642
7673
7304
2611
2642
0.73
0,74
2358
2327
26T3
204
1.22
1.23
124
J12
1093
3907
3025
(A)
(a)
Proportion
in Body
(A
Proportian
Body
Propartion
Between Mean and z
2296
Proportion
in Tal
Proportion
Between Mean and z
Proportion
in Ta
0.75
0.76
7734
2734
2764
1.25
1.26
8944
1056
3944
-7764
2236
2206
2177
2148
8962
0.00
001
5000
3040
SO60
077
0.78
7794
7823
2794
2823
2852
5000
.0000
0.25
0.26
5987
A013
4960
4920
3974
3036
1.27
1.28
3980
3997
0040
3907
0.02
1064
0.79
T852
027
0.28
1.29
9015
A015
0120
6103
5120
S160
030
2119
1.30
9032
9049
A032
029
1141
7910
7939
004
6141
081
082
083
2910
2939
2067
1.31
1.32
INSI
0934
6179
1179
1217
12s5
0199
0.30
3199
5230
2061
2033
2005
A06
476
4721
0239
0279
031
0.32
033
3783
7967
7995
133
134
0.06
902
084
3745
3707
0,07
2995
5279
5319
6293
1293
J331
085
3023
1977
3003
3051
135
136
9115
.9131
4115
4131
0.09
A641
0359
034
1949
1922
1894
9147
9162
5398
035
3078
4602
A562
137
1.38
1.99
0853
0.36
0.37
4147
4162
4177
0438
6406
6443
3106
3133
348
5478
5517
3557
8133
3557
520
1443
1867
AS22
4483
9177
O823
0517
013
014
038
0.39
0.90
1841
1814
1788
3139
3186
192
9207
9222
140
A192
4443
015
a16
040
041
091
0.92
093
1.41
1.42
1.43
3446
(1554)
1591
1628
8212
K238
A212
3238
4404
6554
6591
4222
A364
A325
426
4247
0636
3409
3372
1762
1736
O764
0349
0675
0714
094
3264
3
3315
3340
3365
5675
5714
042
1.44
9251
0.17
0.18
0.19
4251
0.95
1711
145
1.46
147
735
0721
0708
0694
044
600
3300
1700
9279
9292
9306
9319
096
0.97
8315
K340
4279
4292
20
021
0.22
0.23
1736
1772
3793
S832
5871
5910
045
046
0.47
4207
A168
6736
6772
3264
3228
OK32
0.98
365
1635
148
L49
4306
4319
3192
4129
4090
1611
3389
.0681
1844
1879
0910
048
4
0.24
5948
0.49
3121

Transcribed Image Text:John drives to work each morning, and the trip takes an average of u = 38 minutes. The distribution of driving times is approximately normal with a
standard deviation of o = 5 minutes. For a randomly selected morning, what is the probability that John's drive to work will take less than 35 minutes?
Expert Solution
This question has been solved!
Explore an expertly crafted, step-by-step solution for a thorough understanding of key concepts.

This is a popular solution!

Trending now
This is a popular solution!

Step by step
Solved in 2 steps with 2 images

Knowledge Booster


Learn more about
Need a deep-dive on the concept behind this application? Look no further. Learn more about this topic, statistics and related others by exploring similar questions and additional content below.Recommended textbooks for you
MATLAB: An Introduction with Applications
Statistics
ISBN:
9781119256830
Author:
Amos Gilat
Publisher:
John Wiley & Sons Inc

Probability and Statistics for Engineering and th…
Statistics
ISBN:
9781305251809
Author:
Jay L. Devore
Publisher:
Cengage Learning

Statistics for The Behavioral Sciences (MindTap C…
Statistics
ISBN:
9781305504912
Author:
Frederick J Gravetter, Larry B. Wallnau
Publisher:
Cengage Learning
MATLAB: An Introduction with Applications
Statistics
ISBN:
9781119256830
Author:
Amos Gilat
Publisher:
John Wiley & Sons Inc
Probability and Statistics for Engineering and th…
Statistics
ISBN:
9781305251809
Author:
Jay L. Devore
Publisher:
Cengage Learning
Statistics for The Behavioral Sciences (MindTap C…
Statistics
ISBN:
9781305504912
Author:
Frederick J Gravetter, Larry B. Wallnau
Publisher:
Cengage Learning

Elementary Statistics: Picturing the World (7th E…
Statistics
ISBN:
9780134683416
Author:
Ron Larson, Betsy Farber
Publisher:
PEARSON

The Basic Practice of Statistics
Statistics
ISBN:
9781319042578
Author:
David S. Moore, William I. Notz, Michael A. Fligner
Publisher:
W. H. Freeman

Introduction to the Practice of Statistics
Statistics
ISBN:
9781319013387
Author:
David S. Moore, George P. McCabe, Bruce A. Craig
Publisher:
W. H. Freeman