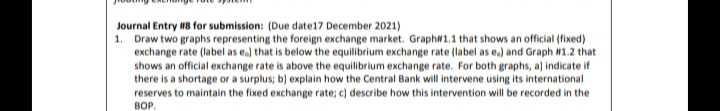
Journal Entry 8 for submission: (Due date17 December 2021) 1. Draw two graphs representing the foreign exchange market. Graph#1.1 that shows an official (fixed) exchange rate (label as e.) that is below the equilibrium exchange rate (label as e.) and Graph W1.2 that shows an official exchange rate is above the equilibrium exchange rate. For both graphs, a) indicate if there is a shortage or a surplus; b) explain how the Central Bank will intervene using its international reserves to maintain the fixed exchange rate; c) describe how this intervention will be recorded in the BOP.
Journal Entry 8 for submission: (Due date17 December 2021) 1. Draw two graphs representing the foreign exchange market. Graph#1.1 that shows an official (fixed) exchange rate (label as e.) that is below the equilibrium exchange rate (label as e.) and Graph W1.2 that shows an official exchange rate is above the equilibrium exchange rate. For both graphs, a) indicate if there is a shortage or a surplus; b) explain how the Central Bank will intervene using its international reserves to maintain the fixed exchange rate; c) describe how this intervention will be recorded in the BOP.

Principles of Economics (MindTap Course List)
8th Edition
ISBN:9781305585126
Author:N. Gregory Mankiw
Publisher:N. Gregory Mankiw
Chapter32: A Macroeconomic Theory Of The Open Economy
Section: Chapter Questions
Problem 3PA

Related questions
Question
1.) Draw two graphs representing the foreign exchange market. Graph 1.1 that shows an official (fixed) exchange rate (label as eo) that is below the equilibrium exchange rate (label as ee) and Graph 1.2 that shows an official exchange rate that is above the equilibrium exchange rate. For both graphs, a.) indicate if there is a shortage or a surplus. b.) explain how the Central Bank will intervene using its international reserves to maintain the fixed exchange rate; c.) describe how this intervention will be recorded in the BOP
Transcribed Image Text:Journal Entry 8 for submission: (Due date17 December 2021)
1. Draw two graphs representing the foreign exchange market. Graphw1.1 that shows an official (fixed)
exchange rate (label as e) that is below the equilibrium exchange rate (label as e.) and Graph W1.2 that
shows an official exchange rate is above the equilibrium exchange rate. For both graphs, a) indicate if
there is a shortage or a surplus; b) explain how the Central Bank will intervene using its international
reserves to maintain the fixed exchange rate; c) describe how this intervention will be recorded in the
BOP.
Expert Solution
This question has been solved!
Explore an expertly crafted, step-by-step solution for a thorough understanding of key concepts.

Step by step
Solved in 3 steps with 2 images

Knowledge Booster


Learn more about
Need a deep-dive on the concept behind this application? Look no further. Learn more about this topic, economics and related others by exploring similar questions and additional content below.Recommended textbooks for you
Principles of Economics (MindTap Course List)
Economics
ISBN:
9781305585126
Author:
N. Gregory Mankiw
Publisher:
Cengage Learning

Principles of Economics, 7th Edition (MindTap Cou…
Economics
ISBN:
9781285165875
Author:
N. Gregory Mankiw
Publisher:
Cengage Learning

Brief Principles of Macroeconomics (MindTap Cours…
Economics
ISBN:
9781337091985
Author:
N. Gregory Mankiw
Publisher:
Cengage Learning
Principles of Economics (MindTap Course List)
Economics
ISBN:
9781305585126
Author:
N. Gregory Mankiw
Publisher:
Cengage Learning
Principles of Economics, 7th Edition (MindTap Cou…
Economics
ISBN:
9781285165875
Author:
N. Gregory Mankiw
Publisher:
Cengage Learning
Brief Principles of Macroeconomics (MindTap Cours…
Economics
ISBN:
9781337091985
Author:
N. Gregory Mankiw
Publisher:
Cengage Learning

Principles of Macroeconomics (MindTap Course List)
Economics
ISBN:
9781285165912
Author:
N. Gregory Mankiw
Publisher:
Cengage Learning

Principles of Macroeconomics (MindTap Course List)
Economics
ISBN:
9781305971509
Author:
N. Gregory Mankiw
Publisher:
Cengage Learning
