Justify your answer: Table 4. Half Life of CO, at Different Initial Pressures Pcoz. Half Life Bar CO2, s 0.7018 0.6971 initial 1.00 2.00 3.00 4.00 0.6954 0.6954 Do the Data from Table 4 support your conclusion about the rate order? Justify your answer: Compare the results of two methods:
Justify your answer: Table 4. Half Life of CO, at Different Initial Pressures Pcoz. Half Life Bar CO2, s 0.7018 0.6971 initial 1.00 2.00 3.00 4.00 0.6954 0.6954 Do the Data from Table 4 support your conclusion about the rate order? Justify your answer: Compare the results of two methods:

Chemistry
10th Edition
ISBN:9781305957404
Author:Steven S. Zumdahl, Susan A. Zumdahl, Donald J. DeCoste
Publisher:Steven S. Zumdahl, Susan A. Zumdahl, Donald J. DeCoste
Chapter1: Chemical Foundations
Section: Chapter Questions
Problem 1RQ: Define and explain the differences between the following terms. a. law and theory b. theory and...

Related questions
Question
Please help with unanswered parts
Transcribed Image Text:132
Justify your answer:
133
134
135
136
137
138
139
140
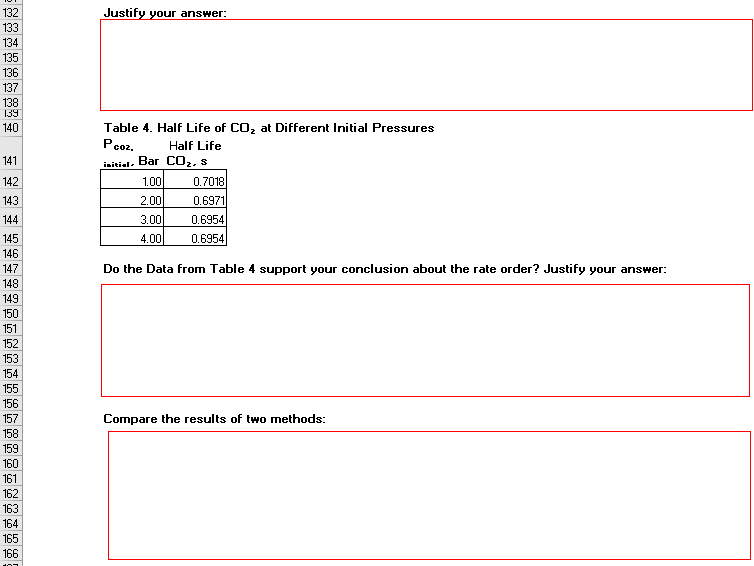
Table 4. HalF Life of CO, at Different Initial Pressures
P,
co2,
Half Life
141
Bar COz, s
initial-
142
1.00
0.7018
143
2.00
0.6971
144
3.00
0.6954
145
4.00
0.6954
146
147
Do the Data from Table 4 support your conclusion about the rate order? Justify your answer:
148
149
150
151
152
153
154
155
156
157
Compare the results of two methods:
158
159
160
161
162
163
164
165
166
![87
Part I. Integrated Rate Law
89
Table 3. Data for the Graphical Analysis
90
91
Time, s
P coz
InP
VP
co2
co2
[CO2] vs Time
92
1
1.00E+00
1.00E +00
1.20E+00
93
2
0.271
7.63E-01
-0.2711357
1.31E+00
1.00E+00
94
3
0.542
5.81E-01
-0.5422716
1.72E+00
8.00E-01
95
4
0.813
4.43E-01
-0.813407
2.26E+00
v=03187x+0.7952
R = 0.8819
96
1.084
3.38E-01
-1.0845437
2.96E+00
6.00E-01
97
6
1.355
2.58E-01
-1.3556798
3.88E+00
4.00E-01
98
1.626
1.97E-01
-1.626813
5.09E +00
2.00E-01
99
1.897
1.50E-01
-1.897947
6.67E+00
0.00E+00
100
2.168
1.14E-01
-2.1690862
8.75E+00
15
2.5
-2.00E-01
101
10
2.439
8.71E-02
-2.4402197
1.15E+01
Time, s
102
11
2.709
6.65E-02 -2.7103549
1.50E+01
103
104
Graph 3. P vs t. Show trendline equation, R, give it a proper title.
105
106
107
In[CO2] vs Time
1/[CO2] vs Time
108
1.60E+01
109
1
1.5
2
2,5
1.40E+01
-0.5
110
1.20E+01
y=4.7936x - 1.0271
R=0.8819
111
-1
1.00E+01
112
8.00E+00
113
-15
6.00E+00
114
y=-1.0005x - GE-07
R =1
-2
4.00E+00
115
2.00E+00
116
-2.5
0.00E+00
117
as
1,5
2
25
-3
-2.00E+00
118
Time, s
Time, s
119
120
121
122
Graph 4. InP vst. Show trendline equation, R, give it a proper ti
Graph 5. 1P vs t. Show trendline equation, R, give it a proper title
123
Compare the trendline equations alone with R? for three graphs and make a conclusion about the order
of reaction
124
125
126
The order with respect to CO2
is:
First Order
127
128
The rate constant is (use correct units):
1.0005
129
130
The integrated rate law is:
In[co2)
(co2]
1/[CO2]](/v2/_next/image?url=https%3A%2F%2Fcontent.bartleby.com%2Fqna-images%2Fquestion%2F435327ce-ad1d-47b0-9d05-42b05e19b7ae%2Fc0e76ae7-600a-4c99-9f85-5927db1fad60%2Fkr9fa0p_processed.png&w=3840&q=75)
Transcribed Image Text:87
Part I. Integrated Rate Law
89
Table 3. Data for the Graphical Analysis
90
91
Time, s
P coz
InP
VP
co2
co2
[CO2] vs Time
92
1
1.00E+00
1.00E +00
1.20E+00
93
2
0.271
7.63E-01
-0.2711357
1.31E+00
1.00E+00
94
3
0.542
5.81E-01
-0.5422716
1.72E+00
8.00E-01
95
4
0.813
4.43E-01
-0.813407
2.26E+00
v=03187x+0.7952
R = 0.8819
96
1.084
3.38E-01
-1.0845437
2.96E+00
6.00E-01
97
6
1.355
2.58E-01
-1.3556798
3.88E+00
4.00E-01
98
1.626
1.97E-01
-1.626813
5.09E +00
2.00E-01
99
1.897
1.50E-01
-1.897947
6.67E+00
0.00E+00
100
2.168
1.14E-01
-2.1690862
8.75E+00
15
2.5
-2.00E-01
101
10
2.439
8.71E-02
-2.4402197
1.15E+01
Time, s
102
11
2.709
6.65E-02 -2.7103549
1.50E+01
103
104
Graph 3. P vs t. Show trendline equation, R, give it a proper title.
105
106
107
In[CO2] vs Time
1/[CO2] vs Time
108
1.60E+01
109
1
1.5
2
2,5
1.40E+01
-0.5
110
1.20E+01
y=4.7936x - 1.0271
R=0.8819
111
-1
1.00E+01
112
8.00E+00
113
-15
6.00E+00
114
y=-1.0005x - GE-07
R =1
-2
4.00E+00
115
2.00E+00
116
-2.5
0.00E+00
117
as
1,5
2
25
-3
-2.00E+00
118
Time, s
Time, s
119
120
121
122
Graph 4. InP vst. Show trendline equation, R, give it a proper ti
Graph 5. 1P vs t. Show trendline equation, R, give it a proper title
123
Compare the trendline equations alone with R? for three graphs and make a conclusion about the order
of reaction
124
125
126
The order with respect to CO2
is:
First Order
127
128
The rate constant is (use correct units):
1.0005
129
130
The integrated rate law is:
In[co2)
(co2]
1/[CO2]
Expert Solution
This question has been solved!
Explore an expertly crafted, step-by-step solution for a thorough understanding of key concepts.

Step by step
Solved in 3 steps

Knowledge Booster


Learn more about
Need a deep-dive on the concept behind this application? Look no further. Learn more about this topic, chemistry and related others by exploring similar questions and additional content below.Recommended textbooks for you
Chemistry
Chemistry
ISBN:
9781305957404
Author:
Steven S. Zumdahl, Susan A. Zumdahl, Donald J. DeCoste
Publisher:
Cengage Learning

Chemistry
Chemistry
ISBN:
9781259911156
Author:
Raymond Chang Dr., Jason Overby Professor
Publisher:
McGraw-Hill Education

Principles of Instrumental Analysis
Chemistry
ISBN:
9781305577213
Author:
Douglas A. Skoog, F. James Holler, Stanley R. Crouch
Publisher:
Cengage Learning
Chemistry
Chemistry
ISBN:
9781305957404
Author:
Steven S. Zumdahl, Susan A. Zumdahl, Donald J. DeCoste
Publisher:
Cengage Learning
Chemistry
Chemistry
ISBN:
9781259911156
Author:
Raymond Chang Dr., Jason Overby Professor
Publisher:
McGraw-Hill Education
Principles of Instrumental Analysis
Chemistry
ISBN:
9781305577213
Author:
Douglas A. Skoog, F. James Holler, Stanley R. Crouch
Publisher:
Cengage Learning

Organic Chemistry
Chemistry
ISBN:
9780078021558
Author:
Janice Gorzynski Smith Dr.
Publisher:
McGraw-Hill Education

Chemistry: Principles and Reactions
Chemistry
ISBN:
9781305079373
Author:
William L. Masterton, Cecile N. Hurley
Publisher:
Cengage Learning

Elementary Principles of Chemical Processes, Bind…
Chemistry
ISBN:
9781118431221
Author:
Richard M. Felder, Ronald W. Rousseau, Lisa G. Bullard
Publisher:
WILEY