kecond question These data represent the marks of thirty students in an exam in one of the subjects. The following is required at the bottom of the table: 10 12 10 21 42 26 22 43 38 44 39 42 40 15 23 17 23 41 36 20 13 22 14 32 36 20 25 34 35 17 1- Present your data in the table in a stem-and-leaf manner within 4 categories
kecond question These data represent the marks of thirty students in an exam in one of the subjects. The following is required at the bottom of the table: 10 12 10 21 42 26 22 43 38 44 39 42 40 15 23 17 23 41 36 20 13 22 14 32 36 20 25 34 35 17 1- Present your data in the table in a stem-and-leaf manner within 4 categories

Glencoe Algebra 1, Student Edition, 9780079039897, 0079039898, 2018
18th Edition
ISBN:9780079039897
Author:Carter
Publisher:Carter
Chapter10: Statistics
Section: Chapter Questions
Problem 27SGR

Related questions
Question
Transcribed Image Text:becond question
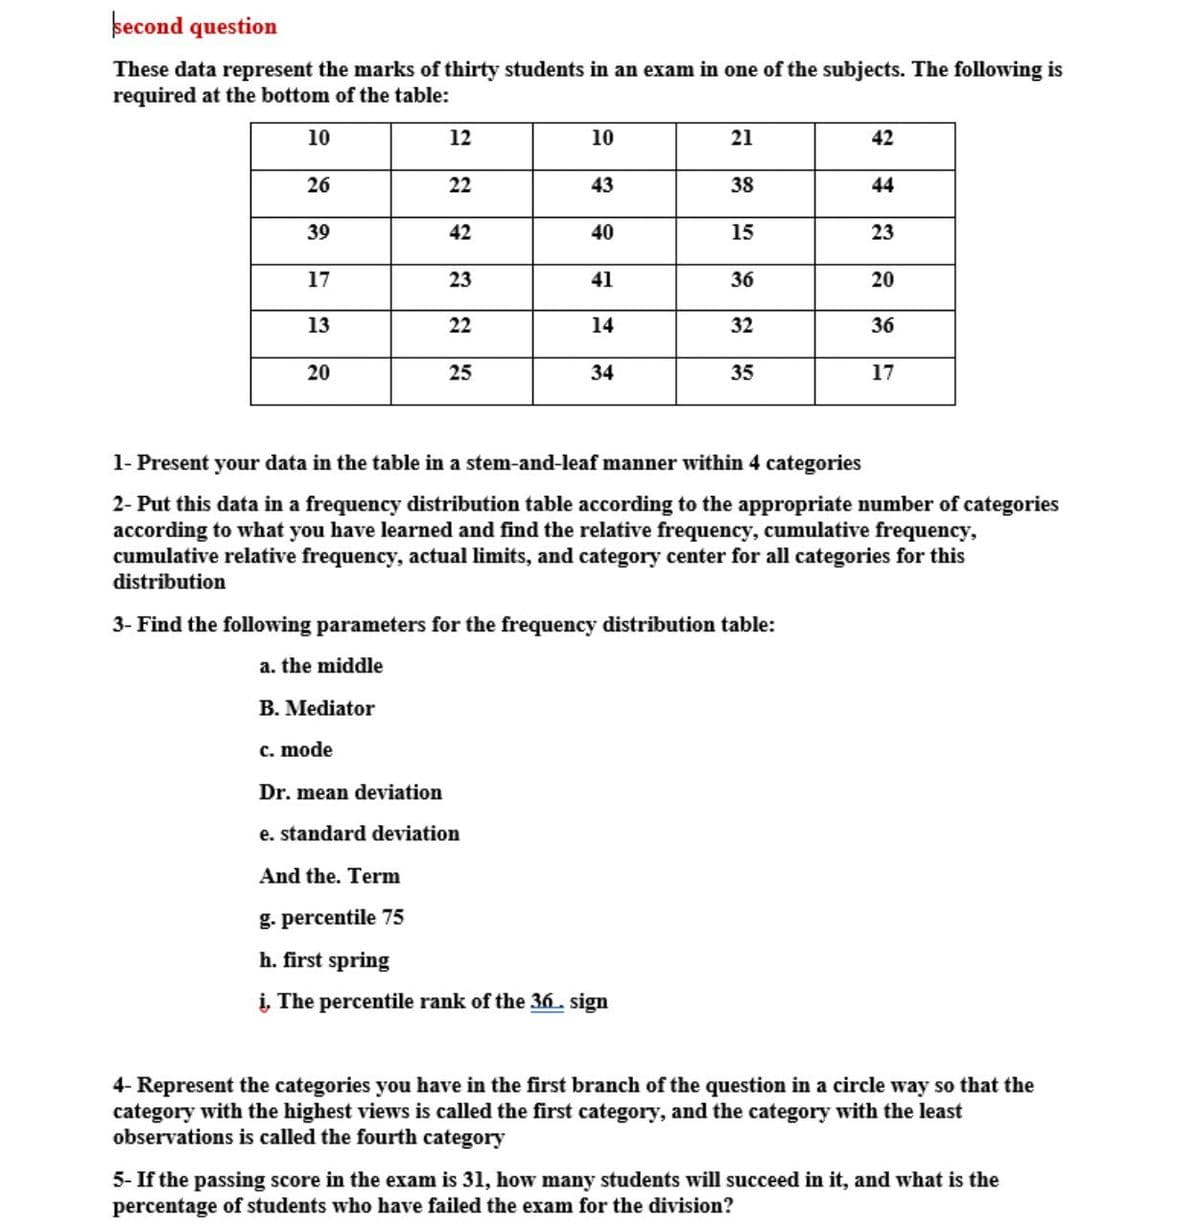
These data represent the marks of thirty students in an exam in one of the subjects. The following is
required at the bottom of the table:
10
12
10
21
42
26
22
43
38
44
39
42
40
15
23
17
23
41
36
20
13
22
14
32
36
20
25
34
35
17
1- Present your data in the table in a stem-and-leaf manner within 4 categories
2- Put this data in a frequency distribution table according to the appropriate number of categories
according to what you have learned and find the relative frequency, cumulative frequency,
cumulative relative frequency, actual limits, and category center for all categories for this
distribution
3- Find the following parameters for the frequency distribution table:
a. the middle
B. Mediator
c. mode
Dr. mean deviation
e. standard deviation
And the. Term
g. percentile 75
h. first spring
į, The percentile rank of the 36. sign
4- Represent the categories you have in the first branch of the question in a circle way so that the
category with the highest views is called the first category, and the category with the least
observations is called the fourth category
5- If the passing score in the exam is 31, how many students will succeed in it, and what is the
percentage of students who have failed the exam for the division?
Expert Solution
This question has been solved!
Explore an expertly crafted, step-by-step solution for a thorough understanding of key concepts.

Step by step
Solved in 2 steps

Recommended textbooks for you
Glencoe Algebra 1, Student Edition, 9780079039897…
Algebra
ISBN:
9780079039897
Author:
Carter
Publisher:
McGraw Hill

Holt Mcdougal Larson Pre-algebra: Student Edition…
Algebra
ISBN:
9780547587776
Author:
HOLT MCDOUGAL
Publisher:
HOLT MCDOUGAL
Glencoe Algebra 1, Student Edition, 9780079039897…
Algebra
ISBN:
9780079039897
Author:
Carter
Publisher:
McGraw Hill
Holt Mcdougal Larson Pre-algebra: Student Edition…
Algebra
ISBN:
9780547587776
Author:
HOLT MCDOUGAL
Publisher:
HOLT MCDOUGAL