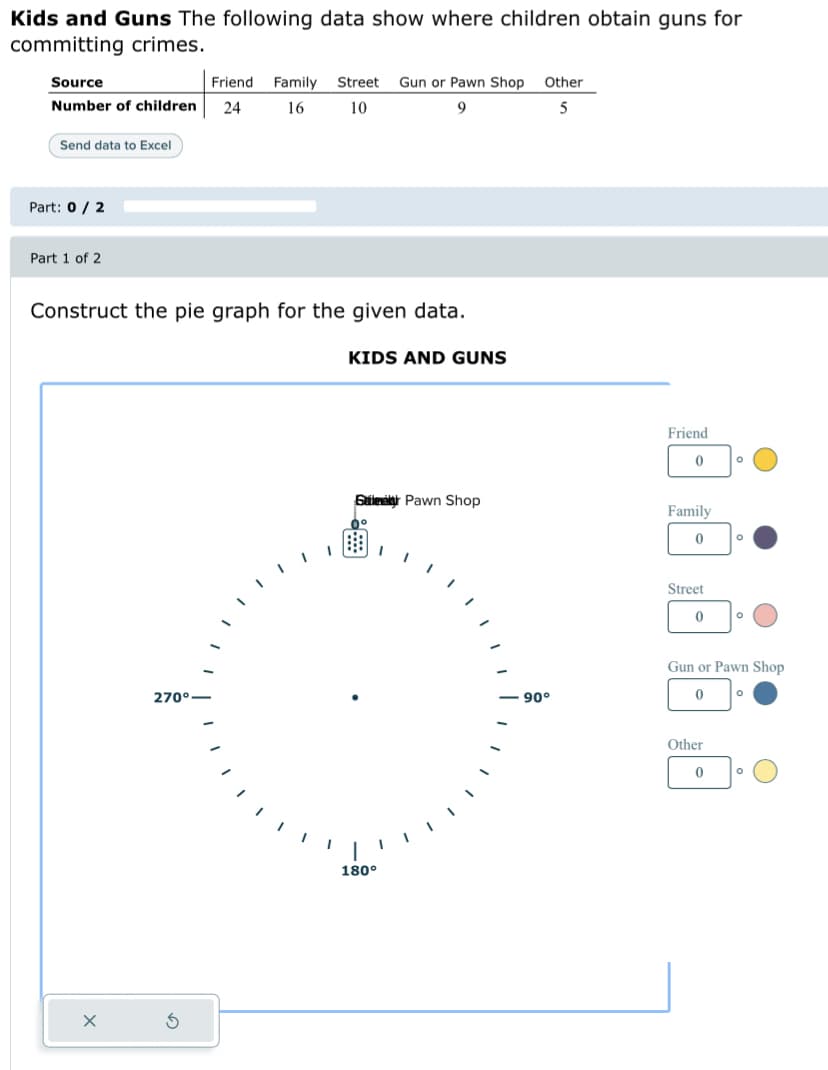
Kids and Guns The following data show where children obtain guns for committing crimes. Source Number of children Send data to Excel Part: 0/2 Part 1 of 2 Friend Family Street Gun or Pawn Shop Other 24 16 10 9 5 Construct the pie graph for the given data. KIDS AND GUNS 270°- By Pawn Shop 180° 90° Friend 0 Family 0 Street 0 Gun or Pawn Shop Other 0


Q: 120 psychology students took a standardized test. The scores are summarized in the GFDT below.…
A: Given: Scores Frequency 180 - 199 12 200 - 219 13 220 - 239 15 240 - 259 15 260 - 279…
Q: Read and Understand Annabeth wants to find out the severity of ADHD symptoms of her fellow teenagers…
A: The mean and standard deviation (SD) of the experimental group is observed as 4.4 and 0.3,…
Q: 8. A car salesman has 9 used cars for sale. They have a mean price of $6000. What is the total price…
A: q-8 given data sample size n = 9 sample mean x¯ = $6000 total price of all 9 cars ∑x = ?
Q: Walmarts 2016 sales were about $481 billion. Suppose sales are projected to increase at a rate of…
A:
Q: Let X and Y be independent exponentially distributed RVs with parameters A and respectively. Use the…
A: Solution is given below
Q: Scores of an IQ test have a bell-shaped distribution with a mean of 100 and a standard deviation of…
A:
Q: 2. A scientist is studying the effect of exercise on blood pressure. He studie 20 people who…
A: An observational study is a study where a researcher uses observed information to learn or study…
Q: Suppose you were to collect data for the following pair of variables, all elementary-school…
A: Introduction Scatterplot: A scatterplot is a graphical method to display the connection between two…
Q: A personal trainer thinks her clients get better workouts and are stronger if they listen to music…
A: Concept: Hypothesis testing is the process of testing the claim being made about population
Q: Hypothesis: M
A: first of all we have to construct null and alternative hypotheses as follows :- we know that null…
Q: 5) An official at the department of education in Capricorn district plans to use an average of a…
A: Given that: Sample size: n=150 Population standard deviation, σ=9.4
Q: < ☐ The following pie chart displays data that represents the numbers of student loan borrowers (in…
A: Concept: Pie chart are used for graphical representation of quantitative data.
Q: Given N1 = 10 , N2 = 14 find F -critical value
A: Given: N1 = 10 N2 = 14 Formula Used: Degree of freedom = N-1 To Find: F-critical value = ?
Q: Part 1 of 4 What is the class width for a frequency distribution with 7 classes? The class width is…
A: Given : Number of classes = 7
Q: Which line graph (pink or purple) would be in a proper Ogive graph? Pink, because it is an upward…
A: The question is about graphical representation Introduction : Ogive curve also known as cumulative…
Q: Corporation and. Heggnesion The quen equation is: f(x) eget nis begression entive of You & = net(gn)…
A:
Q: How many selected cities have values under 11,508,260? (Compare answer to the table.)
A: From graph as well as from table we see that total 8 cities have values (population) under 11508260.
Q: Professor Chauvet wants to know how quickly her students can type out a text message. So that…
A: The objective is to identify which of the given choices is best measure to describe the center of…
Q: In your initial post, address the following items: 1. Share your data set. See Step 1 in the Python…
A: Dataset is considered from the Daily Temperatures of major cities. Region Country State…
Q: Define random variations?
A: The question is about time series analysis Introduction : Time Series : It is a statistical…
Q: A continuous random variable x is normally distributed with a mean of 1 and a standard deviation of…
A: Given Mean μ=1, standard deviations σ=0.2 X~N(μ=1, σ=0.2) P(X=0.5)=?
Q: Eight independent measurements were made along a line and the standard deviation was found to be…
A: Eight independent measurements were made along a line.
Q: For a standardized normal distribution, calculate the probabilities below a. P(Z < 1.3) b. P(z≥…
A: The random z value in a standard normal curve (i.e., distributed with mean 0 and standard deviation…
Q: A random sample of 15 college students were asked "How many hours per week typically do you work…
A: we will form the frequency table of the given data after arranging them into ascending order
Q: Use the table to find the value that is three standard deviations above and below the mean.…
A:
Q: The additional growth of plants in one week are recorded for 11 plants with a sample standard…
A: given data n = 11 s = 2 x¯ = 10 α = 0.10 df = n-1 = 10
Q: ome Run Leader:
A: While constructing bar graph we have to take care of some rules Title of the graph is supposed to…
Q: The exam scores (out of 100 points) for all students taking an introductory statistics course are…
A: from given box plot, minimum = 25
Q: A recent study of robberies for a certain geographic region showed an average of 1 robbery per 18717…
A: From the provided information, The study showed an average of 1 robbery per 18717 people. And there…
Q: Consider the following weighted averages of independent random variables X1, X2 , X3 all with mean…
A: a) It is given that, the independent random variables X1, X2, X3 with mean µ and variance σ2.
Q: This assignment will assess your ability to calculate the mean, median, mode, variance, and standard…
A: Given: Sample size n = 63 Formula Used: Sample variance s2 = ∑i=1n(Xi-X)2n-1 Where, X is a sample…
Q: When using 1-Var Stats on a scientific or graphing calculator, the resulting statistical output…
A: Introduction: It is required to discuss about the difference between the two different types of…
Q: - For the RV X with PDF f(x) = the mean and the variance of X. 821123 X if 0 < x < 1, if 1 < x < 2,…
A:
Q: Blood pressure values are often reported to the nearest 5 mmHg (100, 105, 110, etc.). Suppose the…
A: Given: Sample size n = 9 Formula Used: Median = 2(n+1)4thterm
Q: A concrete mix is designed to withstand 3000 pounds per square inch (psi) of pressure. The…
A: The following data has been given: 3970,4100,3100,3200,2950,3820,4100,4050,3470 We need to compute…
Q: Scores of an IQ test have a bell-shaped distribution with a mean of 100 and a standard deviation of…
A: Empirical value in the statistic are basic rule or thumb rule used in the probability calculation…
Q: The length of human pregnancies from conception to birth varies according to a distribution that is…
A: Hello! As you have posted more than 3 sub parts, we are answering the first 3 sub-parts. In case…
Q: What is the mode in the graph below? 600- 500- 400- 300 200- Frequency
A: Given data,here frequency distribution graph is given .we have find out the mode of the graph here…
Q: The following are the ages of 13 physics teachers in a school district. 24, 28, 29, 41, 41, 43,…
A: Lower quartile(Q1)=(n+1)4th termUpper quartile(Q3)=3(n+1)4th termSample size(n)=13and the given data…
Q: 4. It is thought that house prices in certain areas are correlated with the quality of schools in…
A: a(i) a(ii) The relationship between House price and School Index is linear as School index…
Q: Read and Understand "A look at the descriptive statistics for males and females show that male…
A: From the given info, the mean of male score is 2.85 with a SD of 0.4. The mean of female score is…
Q: Refer to the accompanying data set and use the 30 screw lengths to construct a frequency…
A: Given: Sample size n = 30 First lower class limit = 1.720 Class width = 0.010
Q: (Refer to Krejcie and Morgan Table) Considering the 1, 200 students in the School of Teacher…
A: The provided information is as follows: Population size =1200Precision =95%
Q: Compute and interpret the coefficient of multiple correlation. Number 4 answer is missing.
A: Correlation coefficient measures strength of relationship between two variables. The coefficient of…
Q: a) Enter the class boundaries if th O A. 13 to to 32 to to 52 53 to to
A: The number required to divide the two various groups is known as the Class Boundary. It is the point…
Q: Here is a data set: 47500 60000 30400 34900 53900 42400 33300 51100 37800 61700 48400 32400 29700…
A: Given: Number of classes k=10 Required: To find the best class width and the first lower class…
Q: How much area is in both tails (combined)? How much area is in each tail?
A: Given frequency distribution X is the number of colors on a national flag.
Q: You do not need to label the axes for a histogram, but you do need The bar graph shows categorical…
A: The statements about two graphs are given. i) Bar graph ii) Histogram Bar graph and histogram both…
Q: mean 5 and variance 8/3
A: We have to find out three numbers with mean 5 and variance 8/3. We know mean is measure of Central…
Q: Answer the following questions with TRUE or FALSE, and explain your answer: (b) If X and Y have…
A: Note: Hi! Thank you for the question. As you have posted multiple independent true/false questions,…

Step by step
Solved in 2 steps with 2 images

- The segmented bar graphs below depict data from the NAAL (National Assessment of Adult Literacy) conduct-ed in 2003. (Source: Kutner, M., et al, Literacy in Everyday Life: Results From the 2003 National Assessment of Adult Lit-eracy (NCES 2007–480).U.S. Department of Education. Washington, DC) Does there appear to be a relationship between volunteer-ism and literacy level? a) Yes, all three bars have the same number of segments.b) Yes, because all three bars have the same height.c) Yes, because the corresponding segments of the threebars have different heights.d) No, because the corresponding segments of the threebars have different heights.e) No, because the sums of the 3 proportions in each barare identical.Number of cards 0 1 2 or 3 4 or more Number of people 66 54 42 41 Construct a pie graph for the given dataWhich statement describes the shape of the data? 1-it is symmetric and has no gaps 2- it is not symmetric and has a peak at 7.00 3- it is a cluster from 1.00-7.00 and has no gaps 4-it is a cluster from 1.00-7.00 and has a peak at 6.00
- 2) A researcher is interested in studying if male smokers and female smokers smoke a different number of cigarettes each day. She takes a sample of 10 male smokers and 10 female smokers from a nearby motorcycle club by asking the first 10 smokers of each gender she encountered. Their results are recorded below. Male 18 25 30 16 24 32 15 27 19 15 Female 12 15 36 30 12 18 34 22 10 12 Answer the following: a. Create appropriate graph(s) that can be used to compare the samples. Using the graph(s) to explain: does it appear that the number of cigarettes smoked by each gender are different? b. To run a formal test, which test will you run and which distribution will you use? Explain why for each. Are there any concerns you have about using the results of this test? c. Write the following hypothesis in symbols: Null Hypothesis: The average number of cigarettes smoked by male and female smokers is the same. H0: ________________________…HR manager in L&B real-state company is working with finance department in improving thesalaries and the following descriptive statistics were obtained ( The table attached ) ( The graph attached ) ------------ The company has hired you to answer the following questions:1) Find the missing values of (a), (b), (c) and (d). 2) Do you think that the salaries in the departments are skewed, justify your answer with proper measurefrom table (2).3) Based on the boxplot for the salaries by department in graph (1), comment on the graph in terms ofexistence of outliers, skewness and which department has higher outliers.4) Based on your answer in (3), comment and compare on the suitable central and absolute dispersionmeasures depending on table (2).5) Based on table (1), do you think the salaries of which group is more homogenous, support your answerand comment on the results.Eight students form a math homework group. The students in the group are Joe, Earl, Zippy, Annette, Stinky, Muriel, Chet, and Oswaldo. Prior to forming the group, Stinky was friends with everyone but Muriel. Muriel was friends with Zippy, Annette, Chet, and Earl. Joe was friends with Stinky, Earl, Oswaldo, and Zippy. Letting an edge between two students represent friendship, which of the following graphs models the friendships among these students?
- The ice cream dessert at a restaurant comes in 4 flavors:strawberry, cookie dough, peanut butter, and lemon.There were 15 ice cream desserts ordered on Friday. Here they are by flavor: lemon, lemon, peanut butter, lemon, peanut butter, strawberry, lemon, strawberry, lemon, lemon, lemon, cookie dough, cookie dough, cookie dough, lemon Draw the bar graph for these data.In a study of fourth, fifth and sixth graders, the following data were collected on their gender and their primary goal. Primary Goal Gender Good Grades (G) Popularity (P) Good at Sports (S) Row Totals Male (M) 113 53 55 221 Female (F) 132 89 26 247 Column Totals 245 142 81 468 a) Since data were collected for variable(s), the correct graph to make is a b) Which of the following is the correct graph for the above data with Primary Goal grouped by Gender. (If using a screenreader and you cannot see the options, use "message instructor" and include a copy of your graph for hand grading.)Rita is a runner. She records the amounts of time that it takes her to run different distances in the scatter plot below. Which statements are true? a) There is a least one outlier represented in the scatter plot. b) There is a linear association between distance and time in the scatter plot. c) There is a nonlinear association between distance and time in the scatter plot. d) There is a positive association between distance and time in the scatter plot. e) There is a negative association between dstance and time in the scatter plot.
- 3. Travel Nicole wants to tour Asia. She will start and end her journey in Tokyo and visit HongKong, Bangkok, Seoul, and Beijing. The airfares available to her betweencities are given in the table. Draw a weighted graph that represents the travel costs between cities and use thealgorithm to find a low-cost route. Highlight/color the edges to show the circuit.A process manufactures plastic tapes in batches of 50 units (tapes). The inspection records of the last 30 batches produced during one week individually by 30 workers of this process revealed the following results: (IMAGE) ) (IT IS IN SPANISH, BUT IT IS UNDERSTANDABLE) worker --- defective tapes --- worker ---- defective tapes The production supervisor, will award a prize to the most outstanding worker of the week and in addition a party will be given in his honor. a) Draw a graph of worker vs. % of non-conforming product. b) What is the average quality level of the week obtained by the workers in this process? c) To whom should the award be assigned?Who was the best worker? Who was the worst worker? d) What would you do to improve the results of this process?A battery manufacturer is interested in the lifetime of its products. Thirty batteries are tested until they fail. The times to failure (in hours) are given below.41.3 21.1 35.6 13.5 4.2 15.8 5.5 5.8 33.6 18.6 24.3 18.1 3.5 8.4 42.1 9.4 10.6 8.913.7 19.6 9.2 5.9 19.4 24.227.3 30.6 29.4 18.0 32.8 15.6 Construct a graph to display the data. The manufacturer claims that 50% of its batteries last longer than 20 h. Describe how your graph shows whether or not this is true.
