known that both populations are approximately normally distributed. At the 0.05 level of signific he mean annual income, μ₁, of childcare workers in Connecticut is greater than the mean annual ailed test. Then complete the parts below. your intermediate computations to at least three decimal places. (If necessary, consult a list of for a) State the null hypothesis Ho and the alternative hypothesis H₁. Ho :O U
known that both populations are approximately normally distributed. At the 0.05 level of signific he mean annual income, μ₁, of childcare workers in Connecticut is greater than the mean annual ailed test. Then complete the parts below. your intermediate computations to at least three decimal places. (If necessary, consult a list of for a) State the null hypothesis Ho and the alternative hypothesis H₁. Ho :O U

Holt Mcdougal Larson Pre-algebra: Student Edition 2012
1st Edition
ISBN:9780547587776
Author:HOLT MCDOUGAL
Publisher:HOLT MCDOUGAL
Chapter11: Data Analysis And Probability
Section11.4: Collecting Data
Problem 5E

Related questions
Question
Transcribed Image Text:L
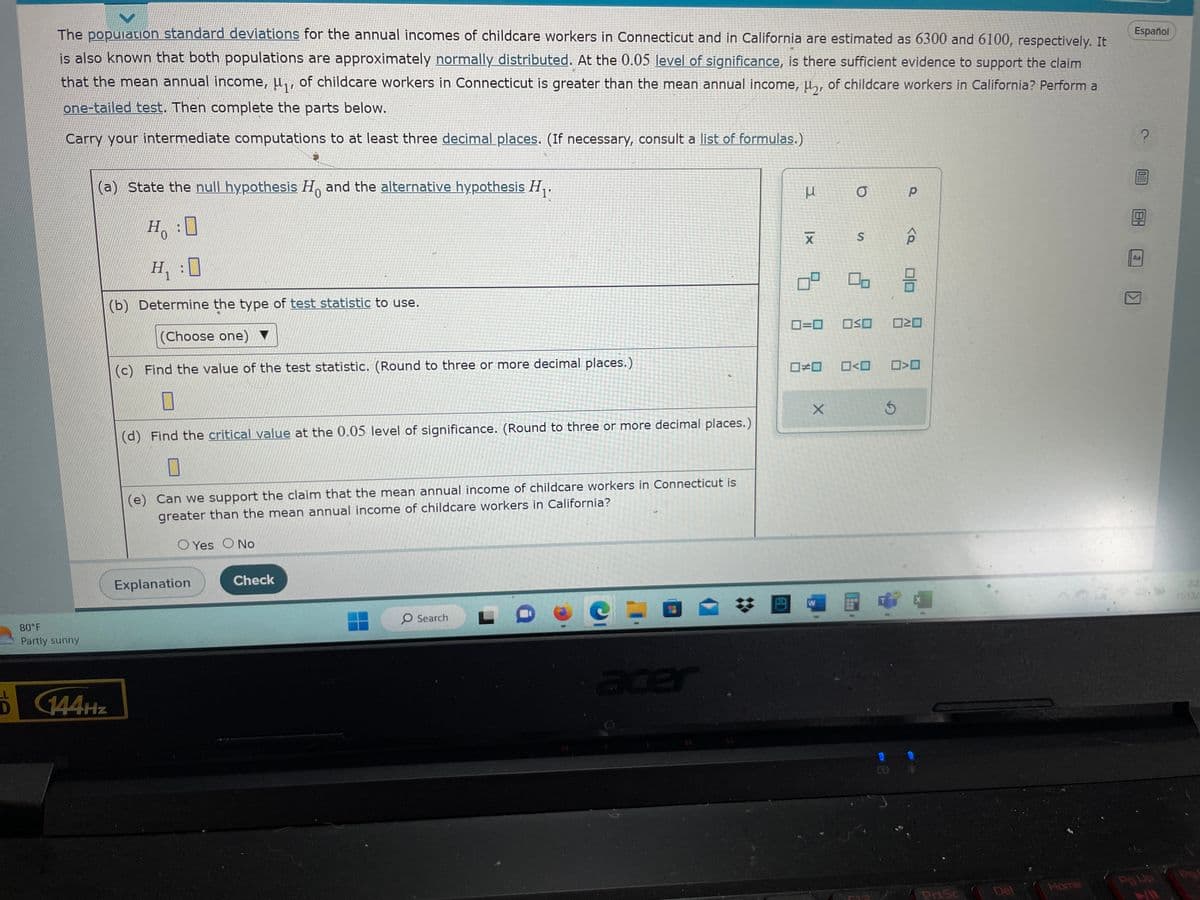
The population standard deviations for the annual incomes of childcare workers in Connecticut and in California are estimated as 6300 and 6100, respectively. It
is also known that both populations are approximately normally distributed. At the 0.05 level of significance, is there sufficient evidence to support the claim
that the mean annual income, μ₁, of childcare workers in Connecticut is greater than the mean annual income, μ₂, of childcare workers in California? Perform a
one-tailed test. Then complete the parts below.
Carry your intermediate computations to at least three decimal places. (If necessary, consult a list of formulas.)
80°F
Partly sunny
(a) State the null hypothesis Ho and the alternative hypothesis H₁.
0
H₁ :0
(b) Determine the type of test statistic to use.
(Choose one)
(c) Find the value of the test statistic. (Round to three or more decimal places.)
0
(d) Find the critical value at the 0.05 level of significance. (Round to three or more decimal places.)
0
(e) Can we support the claim that the mean annual income of childcare workers in Connecticut is
greater than the mean annual income of childcare workers in California?
O Yes O No
D144Hz
Ho
Explanation
Check
O Search
acer
12.9
B
Ix
X
8
□□
0=0 OSO
X
a
W
S
□<口
р
Ś
<Q
믐
²0
0>0
X
PrtSc
Del
das
Home
Español
?
A.a
Pg Up
>/1
2:2
11/13/2
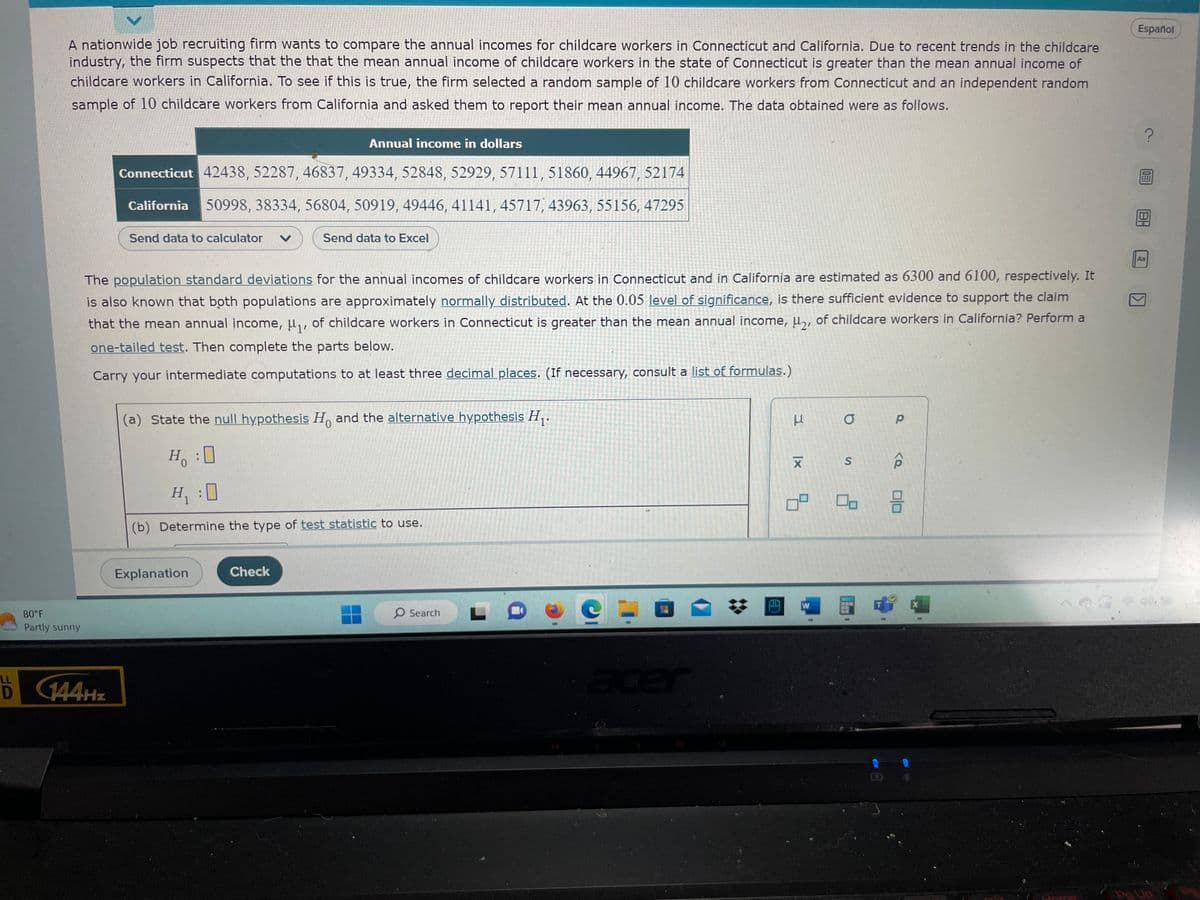
Transcribed Image Text:A nationwide job recruiting firm wants to compare the annual incomes for childcare workers in Connecticut and California. Due to recent trends in the childcare
industry, the firm suspects that the that the mean annual income of childcare workers in the state of Connecticut is greater than the mean annual income of
childcare workers in California. To see if this is true, the firm selected a random sample of 10 childcare workers from Connecticut and an independent random
sample of 10 childcare workers from California and asked them to report their mean annual income. The data obtained were as follows.
80°F
Partly sunny
Annual income in dollars
Connecticut 42438, 52287, 46837, 49334, 52848, 52929, 57111, 51860, 44967, 52174
California 50998, 38334, 56804, 50919, 49446, 41141, 45717, 43963, 55156, 47295
LL
D 144Hz
Send data to calculator V
The population standard deviations for the annual incomes of childcare workers in Connecticut and in California are estimated as 6300 and 6100, respectively. It
is also known that both populations are approximately normally distributed. At the 0.05 level of significance, is there sufficient evidence to support the claim
that the mean annual income, μ₁, of childcare workers in Connecticut is greater than the mean annual income, μ₂, of childcare workers in California? Perform a
one-tailed test. Then complete the parts below.
Carry your intermediate computations to at least three decimal places. (If necessary, consult a list of formulas.)
(a) State the null hypothesis Ho and the alternative hypothesis H₁.
0
Ho
Send data to Excel
H₁ :0
(b) Determine the type of test statistic to use.
Explanation
Check
O Search
acer
✿
A
3
XI
W
a
S
8
P
010
X
Jome
Español
?
0
18
Aa
177
Expert Solution
This question has been solved!
Explore an expertly crafted, step-by-step solution for a thorough understanding of key concepts.

Step by step
Solved in 2 steps with 3 images

Recommended textbooks for you
Holt Mcdougal Larson Pre-algebra: Student Edition…
Algebra
ISBN:
9780547587776
Author:
HOLT MCDOUGAL
Publisher:
HOLT MCDOUGAL

College Algebra (MindTap Course List)
Algebra
ISBN:
9781305652231
Author:
R. David Gustafson, Jeff Hughes
Publisher:
Cengage Learning

Holt Mcdougal Larson Pre-algebra: Student Edition…
Algebra
ISBN:
9780547587776
Author:
HOLT MCDOUGAL
Publisher:
HOLT MCDOUGAL
College Algebra (MindTap Course List)
Algebra
ISBN:
9781305652231
Author:
R. David Gustafson, Jeff Hughes
Publisher:
Cengage Learning