L.Direction: Write the letter that corresponds to the correct answer. 1. Data collected using face-to-face interviews or written questionnaires. A. investigator B. survey C. interviewee D. experimentation 2. The person who gathers data using the observation method. A. interviewee B. interviewer 3. The method used by the physicist in collecting data. A. experimentation B. sample C. investigator 4. A small part of a group chosen to represent the whole group. A. sample B. survey 5. The information A. data C. investigator D. sample D. survey Frequency (f) 5 11 14 17 23 14 8 4 2 2 N=100 collected. B. subject C. experimentation D. investigator C. survey D. sample Class Interval True Limits 91-100 90.5-100.5 81-90 80.5-90.5 71-80 70.5-80.5 61-70 60.5-70.5 51-60 50.5-60.5 41-50 40.5-50.5 31-40 30.5-40.5 21-30 20.5-30.5 11-20 10.5-20.5 1-10 0.5-10.5 6. What is the class interval of the frequency distribution table? A. 9 B. 10 C. 11 7. The total frequency of the table is A. 100 B. 90 C. 80 8. What is the lower limit of the interval 31-40? A. 30.5 B. 31.5 C. 39.5 9. How many students got marks less than 70.5? A. 30 B. 47 C. 53 10. How many pupils got marks greater than 50.5? A. 70 B. 53 C. 47 D. 12 D. 70 D. 40.5 D. 70 D. 30
L.Direction: Write the letter that corresponds to the correct answer. 1. Data collected using face-to-face interviews or written questionnaires. A. investigator B. survey C. interviewee D. experimentation 2. The person who gathers data using the observation method. A. interviewee B. interviewer 3. The method used by the physicist in collecting data. A. experimentation B. sample C. investigator 4. A small part of a group chosen to represent the whole group. A. sample B. survey 5. The information A. data C. investigator D. sample D. survey Frequency (f) 5 11 14 17 23 14 8 4 2 2 N=100 collected. B. subject C. experimentation D. investigator C. survey D. sample Class Interval True Limits 91-100 90.5-100.5 81-90 80.5-90.5 71-80 70.5-80.5 61-70 60.5-70.5 51-60 50.5-60.5 41-50 40.5-50.5 31-40 30.5-40.5 21-30 20.5-30.5 11-20 10.5-20.5 1-10 0.5-10.5 6. What is the class interval of the frequency distribution table? A. 9 B. 10 C. 11 7. The total frequency of the table is A. 100 B. 90 C. 80 8. What is the lower limit of the interval 31-40? A. 30.5 B. 31.5 C. 39.5 9. How many students got marks less than 70.5? A. 30 B. 47 C. 53 10. How many pupils got marks greater than 50.5? A. 70 B. 53 C. 47 D. 12 D. 70 D. 40.5 D. 70 D. 30

Glencoe Algebra 1, Student Edition, 9780079039897, 0079039898, 2018
18th Edition
ISBN:9780079039897
Author:Carter
Publisher:Carter
Chapter10: Statistics
Section10.5: Comparing Sets Of Data
Problem 26PFA

Related questions
Question
100%
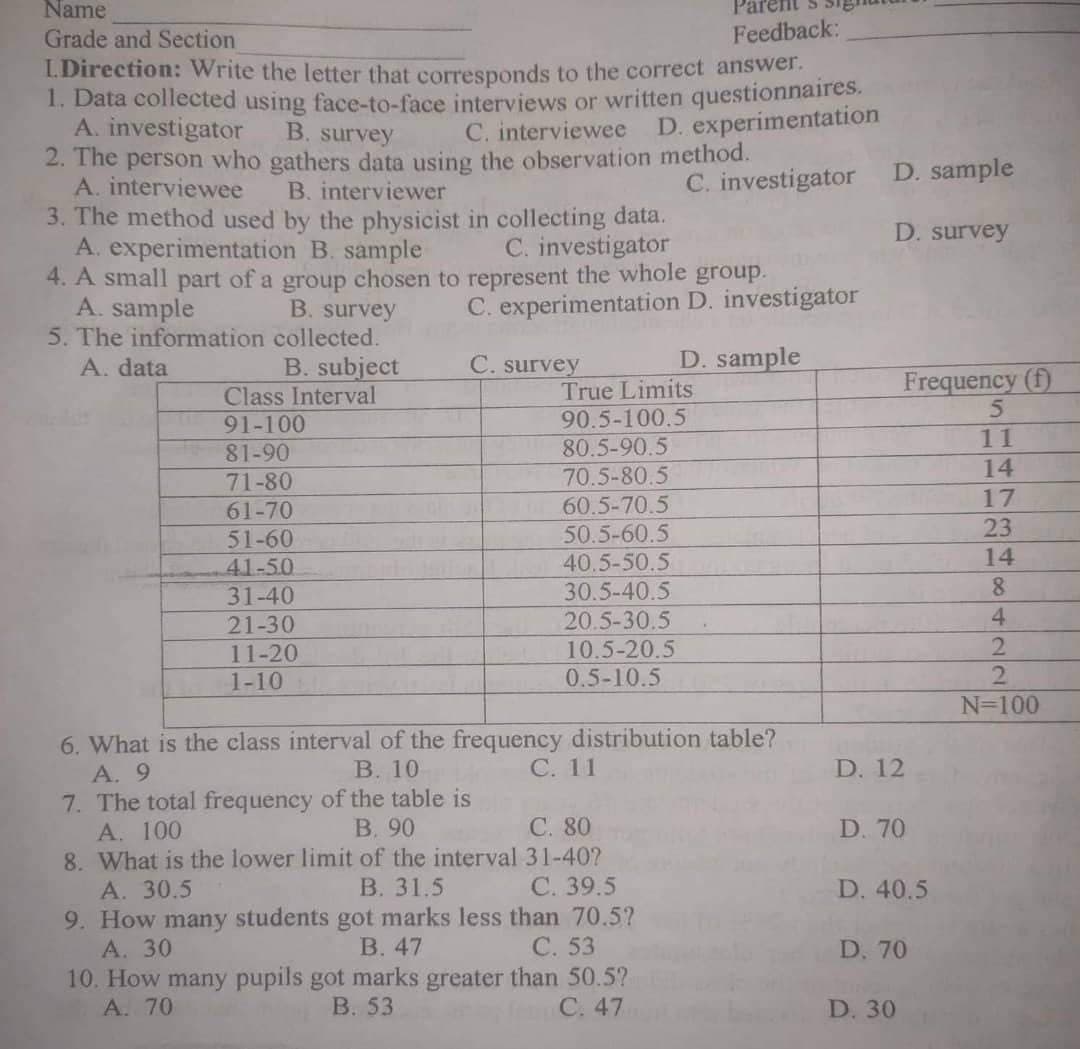
Transcribed Image Text:Name
Grade and Section
Feedback:
I.Direction: Write the letter that corresponds to the correct answer.
1. Data collected using face-to-face interviews or written questionnaires.
A. investigator
B. survey
C. interviewee D. experimentation
2. The person who gathers data using the observation method.
A. interviewee
B. interviewer
3. The method used by the physicist in collecting data.
A. experimentation B. sample
C. investigator
4. A small part of a group chosen to represent the whole group.
A. sample
B. survey
5. The information
A. data
C. investigator D. sample
D. survey
C. experimentation D. investigator
C. survey
D. sample
Class Interval
True Limits
90.5-100.5
91-100
81-90
80.5-90.5
71-80
70.5-80.5
61-70
60.5-70.5
51-60
50.5-60.5
41-50
40.5-50.5
31-40
30.5-40.5
21-30
20.5-30.5
11-20
10.5-20.5
1-10
0.5-10.5
6. What is the class interval of the frequency distribution table?
A. 9
B. 10
C. 11
7. The total frequency of the table is
A. 100
B. 90
C. 80
8. What is the lower limit of the interval
31-40?
A. 30.5
B. 31.5
C. 39.5
9. How many students got marks less than 70.5?
A. 30
B. 47
C. 53
10. How many pupils got marks greater than 50.5?
A. 70
B. 53
C. 47
collected.
B. subject
Frequency (f)
5
11
14
17
23
14
8
4
2
D. 12
D. 70
D. 40.5
D. 70
D. 30
4734
alar
2
N=100
Expert Solution
This question has been solved!
Explore an expertly crafted, step-by-step solution for a thorough understanding of key concepts.

Step by step
Solved in 2 steps

Recommended textbooks for you
Glencoe Algebra 1, Student Edition, 9780079039897…
Algebra
ISBN:
9780079039897
Author:
Carter
Publisher:
McGraw Hill

Holt Mcdougal Larson Pre-algebra: Student Edition…
Algebra
ISBN:
9780547587776
Author:
HOLT MCDOUGAL
Publisher:
HOLT MCDOUGAL

Elementary Geometry For College Students, 7e
Geometry
ISBN:
9781337614085
Author:
Alexander, Daniel C.; Koeberlein, Geralyn M.
Publisher:
Cengage,
Glencoe Algebra 1, Student Edition, 9780079039897…
Algebra
ISBN:
9780079039897
Author:
Carter
Publisher:
McGraw Hill
Holt Mcdougal Larson Pre-algebra: Student Edition…
Algebra
ISBN:
9780547587776
Author:
HOLT MCDOUGAL
Publisher:
HOLT MCDOUGAL
Elementary Geometry For College Students, 7e
Geometry
ISBN:
9781337614085
Author:
Alexander, Daniel C.; Koeberlein, Geralyn M.
Publisher:
Cengage,

Big Ideas Math A Bridge To Success Algebra 1: Stu…
Algebra
ISBN:
9781680331141
Author:
HOUGHTON MIFFLIN HARCOURT
Publisher:
Houghton Mifflin Harcourt