The following statistics represent crime rates per 1000 population for a random sample of 46 Denver neighborhoods. The mean crime rate, 64.2 and standard deviation, s 27.9 crimes per 1000 population a) Let us say that the data are representative of the population crime rates in Denver neighborhoods. (i) Compute the margin of error, E for an 80% confidence interval for u, the population mean crime rate for all Denver neighborhoods (i1) Compute an 80% confidence interval for u, the population mean crime rate for all Denver neighborhoods. b) Suppose you are advising the police department about police patrol assignments. One neighborhood has a crime rate of 57 crimes per 1000 population. Do you think that this rate is below the average population crime rate and that fewer patrols could safely be assigned to this neighborhood? Explain Use the confidence interval to justify your answer. c) Another neighborhood has a crime rate of 75 crimes per 1000 population average? Does this crime rate seem to be higher than the population average? Would you recommend assigning more patrols to this neighborhood? Explain. Use the confidence interval to justify your answer.
The following statistics represent crime rates per 1000 population for a random sample of 46 Denver neighborhoods. The mean crime rate, 64.2 and standard deviation, s 27.9 crimes per 1000 population a) Let us say that the data are representative of the population crime rates in Denver neighborhoods. (i) Compute the margin of error, E for an 80% confidence interval for u, the population mean crime rate for all Denver neighborhoods (i1) Compute an 80% confidence interval for u, the population mean crime rate for all Denver neighborhoods. b) Suppose you are advising the police department about police patrol assignments. One neighborhood has a crime rate of 57 crimes per 1000 population. Do you think that this rate is below the average population crime rate and that fewer patrols could safely be assigned to this neighborhood? Explain Use the confidence interval to justify your answer. c) Another neighborhood has a crime rate of 75 crimes per 1000 population average? Does this crime rate seem to be higher than the population average? Would you recommend assigning more patrols to this neighborhood? Explain. Use the confidence interval to justify your answer.

MATLAB: An Introduction with Applications
6th Edition
ISBN:9781119256830
Author:Amos Gilat
Publisher:Amos Gilat
Chapter1: Starting With Matlab
Section: Chapter Questions
Problem 1P

Related questions
Question
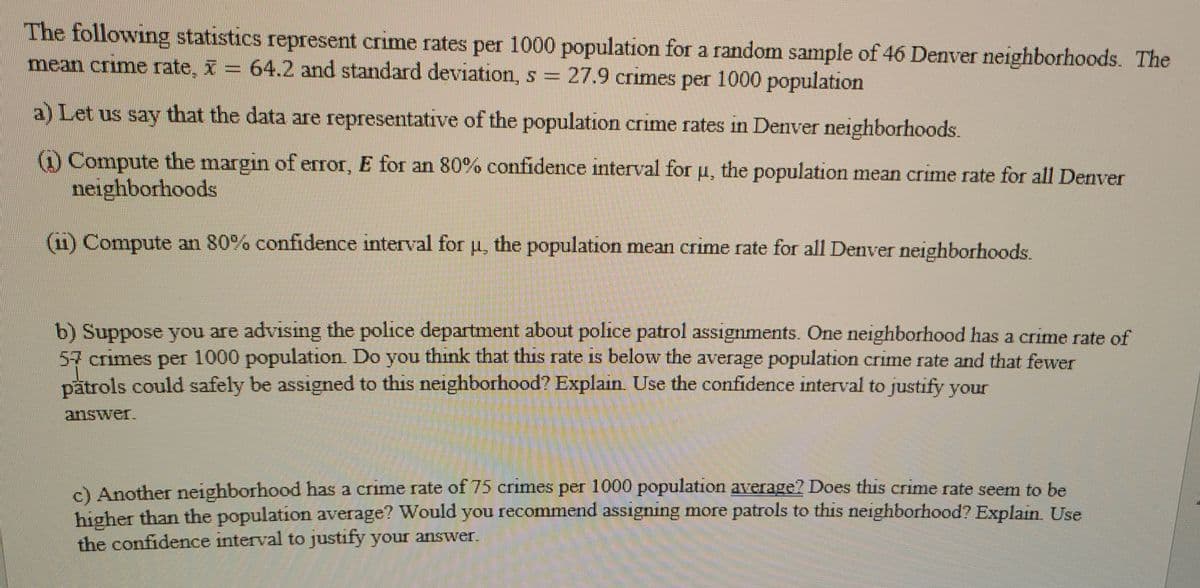
Transcribed Image Text:The following statistics represent crime rates per 1000 population for a random sample of 46 Denver neighborhoods. The
mean crime rate, X= 64.2 and standard deviation, s = 27.9 crimes per 1000 population
a) Let us say that the data are representative of the population crime rates in Denver neighborhoods.
() Compute the margin of error, E for an 80% confidence interval for u, the population mean crime rate for all Denver
neighborhoods
(11) Compute an 80% confidence interval for p, the population mean crime rate for all Denver neighborhoods.
b) Suppose you are advising the police department about police patrol assignments. One neighborhood has a crime rate of
57crimes per 1000 population. Do you think that thiS rate is below the average population crime rate and that fewer
patrols could safely be assigned to this neighborhood? Explain Use the confidence interval to justify your
answer.
c) Another neighborhood has a crime rate of 75 crimes per 1000 population average? Does this crime rate seem to be
higher than the population average? Would you recommerd assigning more patrols to this neighborhood? Explan Use
the confidence interval to justify your answer.
Expert Solution
This question has been solved!
Explore an expertly crafted, step-by-step solution for a thorough understanding of key concepts.

This is a popular solution!

Trending now
This is a popular solution!

Step by step
Solved in 3 steps with 3 images

Follow-up Questions
Read through expert solutions to related follow-up questions below.
Recommended textbooks for you
MATLAB: An Introduction with Applications
Statistics
ISBN:
9781119256830
Author:
Amos Gilat
Publisher:
John Wiley & Sons Inc

Probability and Statistics for Engineering and th…
Statistics
ISBN:
9781305251809
Author:
Jay L. Devore
Publisher:
Cengage Learning

Statistics for The Behavioral Sciences (MindTap C…
Statistics
ISBN:
9781305504912
Author:
Frederick J Gravetter, Larry B. Wallnau
Publisher:
Cengage Learning
MATLAB: An Introduction with Applications
Statistics
ISBN:
9781119256830
Author:
Amos Gilat
Publisher:
John Wiley & Sons Inc
Probability and Statistics for Engineering and th…
Statistics
ISBN:
9781305251809
Author:
Jay L. Devore
Publisher:
Cengage Learning
Statistics for The Behavioral Sciences (MindTap C…
Statistics
ISBN:
9781305504912
Author:
Frederick J Gravetter, Larry B. Wallnau
Publisher:
Cengage Learning

Elementary Statistics: Picturing the World (7th E…
Statistics
ISBN:
9780134683416
Author:
Ron Larson, Betsy Farber
Publisher:
PEARSON

The Basic Practice of Statistics
Statistics
ISBN:
9781319042578
Author:
David S. Moore, William I. Notz, Michael A. Fligner
Publisher:
W. H. Freeman

Introduction to the Practice of Statistics
Statistics
ISBN:
9781319013387
Author:
David S. Moore, George P. McCabe, Bruce A. Craig
Publisher:
W. H. Freeman