Large companies typically collect volumes of data before designing a product, not only to gain information as to whether the product should be released, but also to pinpoint which markets would be the best targets for the product. Several months ago, I was interviewed by such a company while shopping at a mall. I was asked about my exercise habits and whether or not I'd be interested in buying a video/DVD designed to teach stretching exercises. I fall into the male, 18 - 35-years-old category, and I guessed that, like me, many males in that category would not be interested in a stretching video. My friend Salma falls in the female, older-than-35 category, and I was thinking that she might like the stretching video. After being interviewed, I looked at the interviewer's results. Of the 96 people in my market category who had been interviewed, 17 said they would buy the product, and of the 98 people in Salma's market category, 23 said they would buy it. Assuming that these data came from independent, random samples, can we conclude (at the 0.10 level of significance) that the proportion p, of all mall shoppers in my market category who would buy the product is less than the proportion p, of all mall shoppers in Salma's market category who would buy the product? Perform a one-tailed test. Then complete the parts below. Carry your intermediate computations to three or more decimal places and round your answers as specified in the parts below. (If necessary, consult a list of formulas.) (a) State the null hypothesis H, and the alternative hypothesis H, . H. :P, -P2 = 0 Hi :P1 - P2 < 0
Large companies typically collect volumes of data before designing a product, not only to gain information as to whether the product should be released, but also to pinpoint which markets would be the best targets for the product. Several months ago, I was interviewed by such a company while shopping at a mall. I was asked about my exercise habits and whether or not I'd be interested in buying a video/DVD designed to teach stretching exercises. I fall into the male, 18 - 35-years-old category, and I guessed that, like me, many males in that category would not be interested in a stretching video. My friend Salma falls in the female, older-than-35 category, and I was thinking that she might like the stretching video. After being interviewed, I looked at the interviewer's results. Of the 96 people in my market category who had been interviewed, 17 said they would buy the product, and of the 98 people in Salma's market category, 23 said they would buy it. Assuming that these data came from independent, random samples, can we conclude (at the 0.10 level of significance) that the proportion p, of all mall shoppers in my market category who would buy the product is less than the proportion p, of all mall shoppers in Salma's market category who would buy the product? Perform a one-tailed test. Then complete the parts below. Carry your intermediate computations to three or more decimal places and round your answers as specified in the parts below. (If necessary, consult a list of formulas.) (a) State the null hypothesis H, and the alternative hypothesis H, . H. :P, -P2 = 0 Hi :P1 - P2 < 0

Glencoe Algebra 1, Student Edition, 9780079039897, 0079039898, 2018
18th Edition
ISBN:9780079039897
Author:Carter
Publisher:Carter
Chapter10: Statistics
Section10.6: Summarizing Categorical Data
Problem 11CYU

Related questions
Question
C,d,e
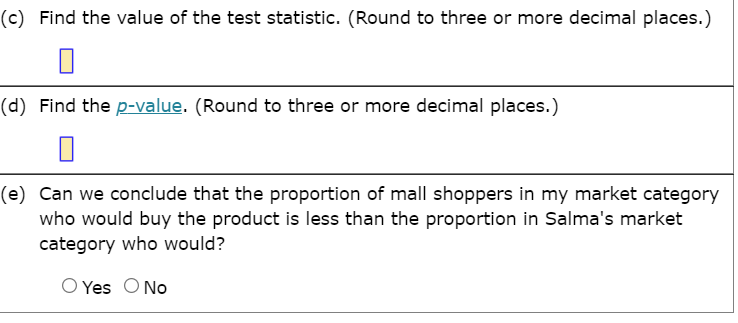
Transcribed Image Text:(c) Find the value of the test statistic. (Round to three or more decimal places.)
(d) Find the p-value. (Round to three or more decimal places.)
(e) Can we conclude that the proportion of mall shoppers in my market category
who would buy the product is less than the proportion in Salma's market
category who would?
O Yes ONo
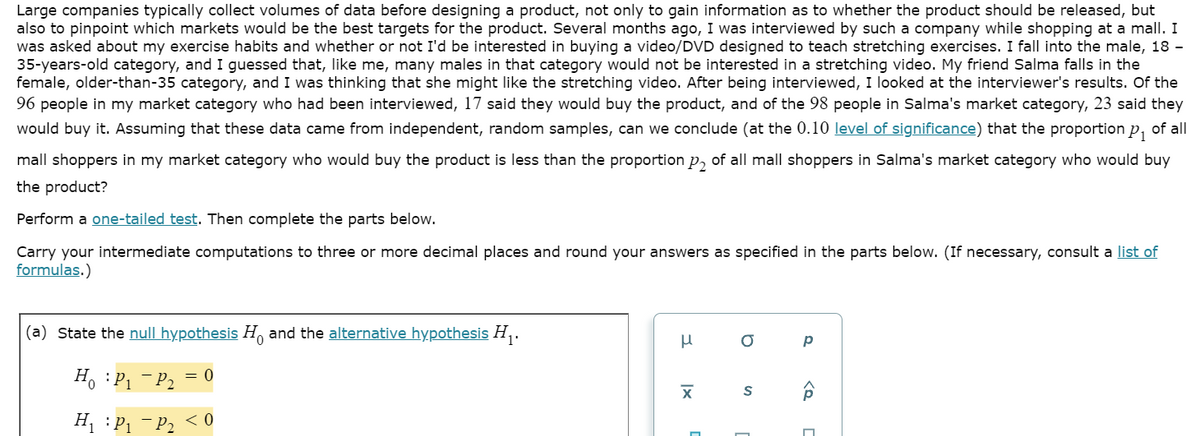
Transcribed Image Text:Large companies typically collect volumes of data before designing a product, not only to gain information as to whether the product should be released, but
also to pinpoint which markets would be the best targets for the product. Several months ago, I was interviewed by such a company while shopping at a mall. I
was asked about my exercise habits and whether or not I'd be interested in buying a video/DVD designed to teach stretching exercises. I fall into the male, 18 -
35-years-old category, and I guessed that, like me, many males in that category would not be interested in a stretching video. My friend Salma falls in the
female, older-than-35 category, and I was thinking that she might like the stretching video. After being interviewed, I looked at the interviewer's results. Of the
96 people in my market category who had been interviewed, 17 said they would buy the product, and of the 98 people in Salma's market category, 23 said they
would buy it. Assuming that these data came from independent, random samples, can we conclude (at the 0.10 level of significance) that the proportion p, of all
mall shoppers in my market category who would buy the product is less than the proportion p, of all mall shoppers in Salma's market category who would buy
the product?
Perform a one-tailed test. Then complete the parts below.
Carry your intermediate computations to three or more decimal places and round your answers as specified in the parts below. (If necessary, consult a list of
formulas.)
(a) State the null hypothesis Ho and the alternative hypothesis H,.
H. :P1 - P2 = 0
Hi :P1 - P2 < 0
Ix
Expert Solution
This question has been solved!
Explore an expertly crafted, step-by-step solution for a thorough understanding of key concepts.

Step by step
Solved in 4 steps with 3 images

Recommended textbooks for you
Glencoe Algebra 1, Student Edition, 9780079039897…
Algebra
ISBN:
9780079039897
Author:
Carter
Publisher:
McGraw Hill

Big Ideas Math A Bridge To Success Algebra 1: Stu…
Algebra
ISBN:
9781680331141
Author:
HOUGHTON MIFFLIN HARCOURT
Publisher:
Houghton Mifflin Harcourt

Glencoe Algebra 1, Student Edition, 9780079039897…
Algebra
ISBN:
9780079039897
Author:
Carter
Publisher:
McGraw Hill
Big Ideas Math A Bridge To Success Algebra 1: Stu…
Algebra
ISBN:
9781680331141
Author:
HOUGHTON MIFFLIN HARCOURT
Publisher:
Houghton Mifflin Harcourt

Algebra: Structure And Method, Book 1
Algebra
ISBN:
9780395977224
Author:
Richard G. Brown, Mary P. Dolciani, Robert H. Sorgenfrey, William L. Cole
Publisher:
McDougal Littell