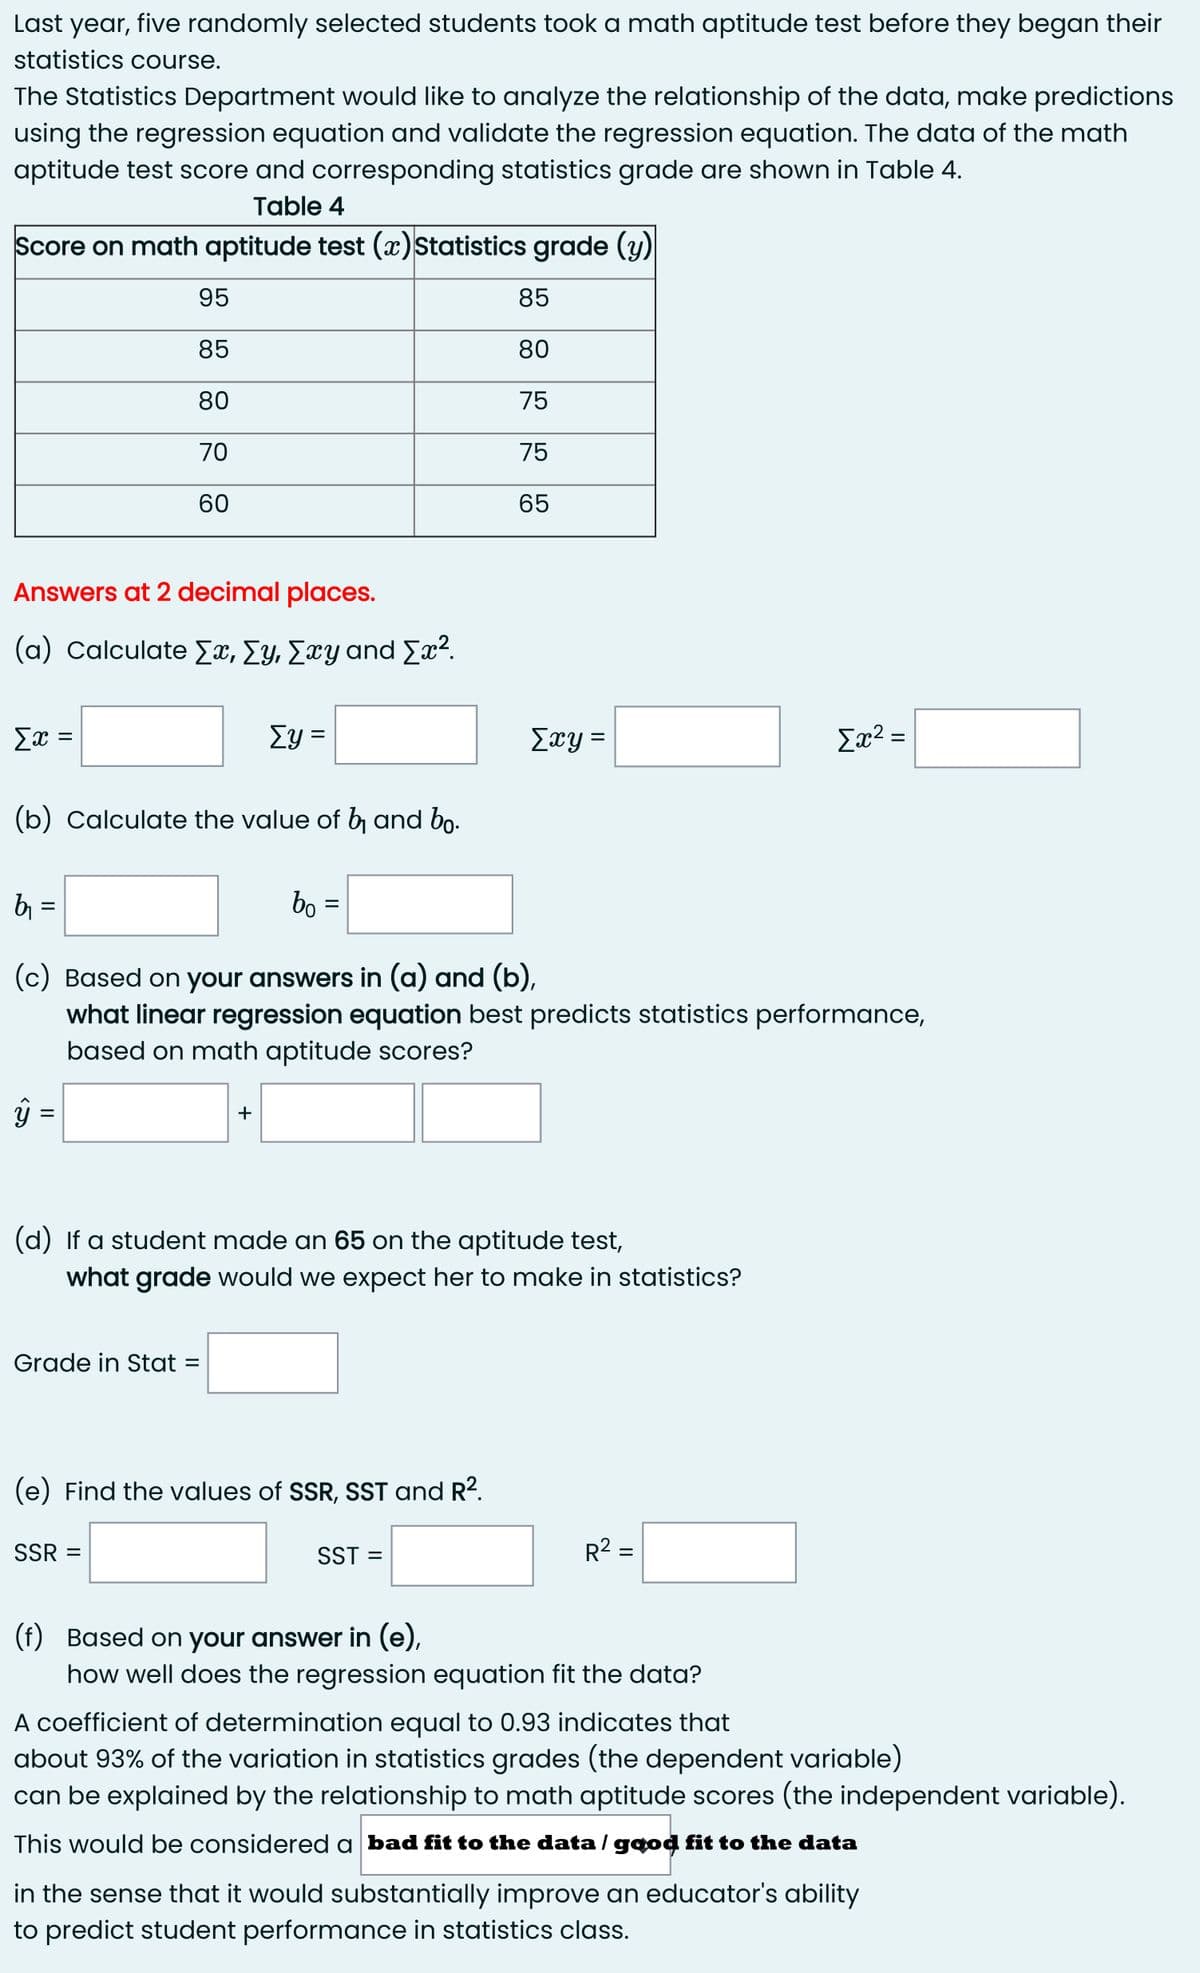
Last five randomly selected students took a math aptitude test before they began their year, statistics course. The Statistics Department would like to analyze the relationship of the data, make predictions using the regression equation and validate the regression equation. The data of the math aptitude test score and corresponding statistics grade are shown in Table 4. Table 4 Score on math aptitude test (x)Statistics grade (y) 95 85 85 80 80 75 70 75 60 65 Answers at 2 decimal places. ( α) Calculate Συ, Σ Σxy and Σα2 Ex = Ey = Exy = Ex2 = (b) Calculate the value of b and bo. bi = bo = %3D %3D (c) Based on your answers in (a) and (b), what linear regression equation best predicts statistics performance, based on math aptitude scores? (d) If a student made an 65 on the aptitude test, what grade would we expect her to make in statistics? Grade in Stat = (e) Find the values of SSR, SST and R2. SSR = SST = R2 = %D (f) Based on your answer in (e), how well does the regression equation fit the data? A coefficient of determination equal to 0.93 indicates that about 93% of the variation in statistics grades (the dependent variable) can be explained by the relationship to math aptitude scores (the independent variable). This would be considered a bad fit to the data / gaod fit to the data in the sense that it would substantially improve an educator's ability to predict student performance in statistics class.


Addition Rule of Probability
It simply refers to the likelihood of an event taking place whenever the occurrence of an event is uncertain. The probability of a single event can be calculated by dividing the number of successful trials of that event by the total number of trials.
Expected Value
When a large number of trials are performed for any random variable ‘X’, the predicted result is most likely the mean of all the outcomes for the random variable and it is known as expected value also known as expectation. The expected value, also known as the expectation, is denoted by: E(X).
Probability Distributions
Understanding probability is necessary to know the probability distributions. In statistics, probability is how the uncertainty of an event is measured. This event can be anything. The most common examples include tossing a coin, rolling a die, or choosing a card. Each of these events has multiple possibilities. Every such possibility is measured with the help of probability. To be more precise, the probability is used for calculating the occurrence of events that may or may not happen. Probability does not give sure results. Unless the probability of any event is 1, the different outcomes may or may not happen in real life, regardless of how less or how more their probability is.
Basic Probability
The simple definition of probability it is a chance of the occurrence of an event. It is defined in numerical form and the probability value is between 0 to 1. The probability value 0 indicates that there is no chance of that event occurring and the probability value 1 indicates that the event will occur. Sum of the probability value must be 1. The probability value is never a negative number. If it happens, then recheck the calculation.
Answer only ( d , e ,f)


Trending now
This is a popular solution!

Step by step
Solved in 2 steps with 3 images


