Last year a bill was passed. Of those who voted, 40 people gave two pieces of information: if they voted yes or no and their height (in inches). Assuming the samples were drawn from populations with the same population variance, find the 95% confidence interval for the difference in means of heights.
Last year a bill was passed. Of those who voted, 40 people gave two pieces of information: if they voted yes or no and their height (in inches). Assuming the samples were drawn from populations with the same population variance, find the 95% confidence interval for the difference in means of heights.

Algebra & Trigonometry with Analytic Geometry
13th Edition
ISBN:9781133382119
Author:Swokowski
Publisher:Swokowski
Chapter10: Sequences, Series, And Probability
Section10.2: Arithmetic Sequences
Problem 68E

Related questions
Question
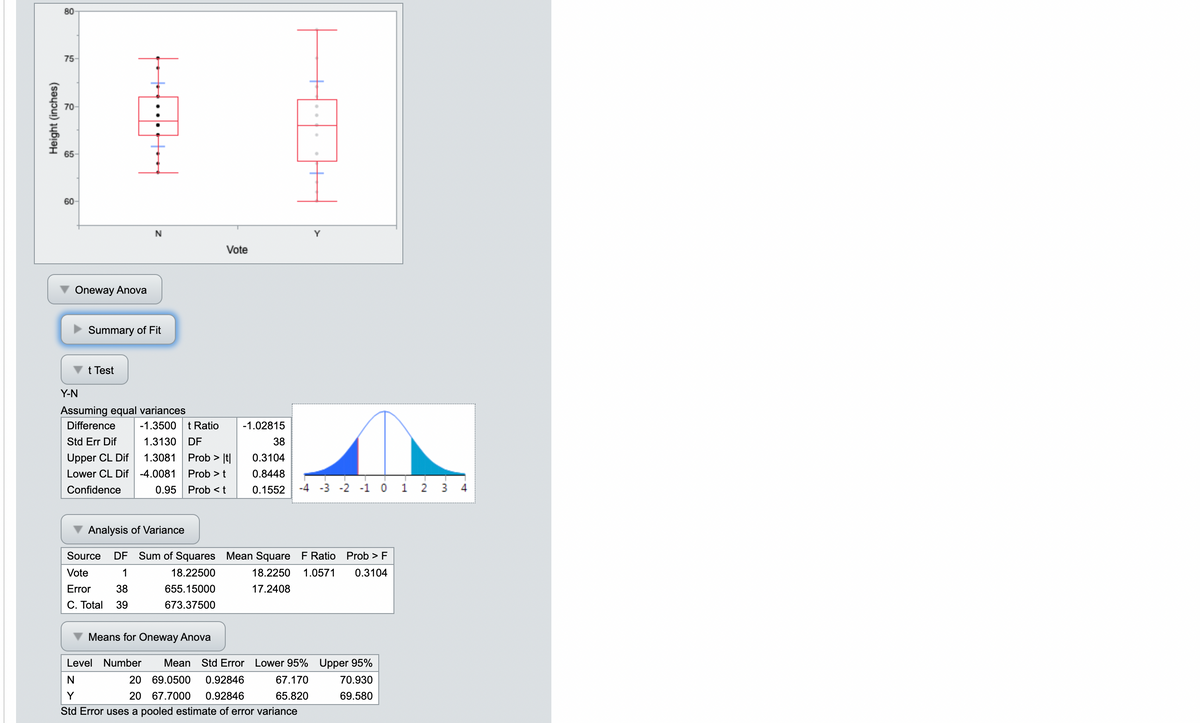
Last year a bill was passed. Of those who voted, 40 people gave two pieces of information: if they voted yes or no and their height (in inches).
Assuming the samples were drawn from populations with the same population variance, find the 95% confidence interval for the difference in means of heights.
Transcribed Image Text:80
75-
70-
60-
Y
Vote
Oneway Anova
Summary of Fit
t Test
Y-N
Assuming equal variances
Difference
-1.3500
t Ratio
-1.02815
Std Err Dif
1.3130
DF
38
Upper CL Dif
1.3081
Prob > It|
0.3104
Lower CL Dif -4.0081
Prob > t
0.8448
Confidence
0.95 Prob <t
0.1552
-4 -3 -2 -1 ó 1 2 3 4
Analysis of Variance
Source
DF
Sum of Squares Mean Square F Ratio Prob > F
Vote
1
18.22500
18.2250
1.0571
0.3104
Error
38
655.15000
17.2408
C. Total
39
673.37500
Means for Oneway Anova
Level Number
Мean
Std Error Lower 95% Upper 95%
N
20
69.0500
0.92846
67.170
70.930
Y
20 67.7000
0.92846
65.820
69.580
Std Error uses a pooled estimate of error variance
Height (inches)
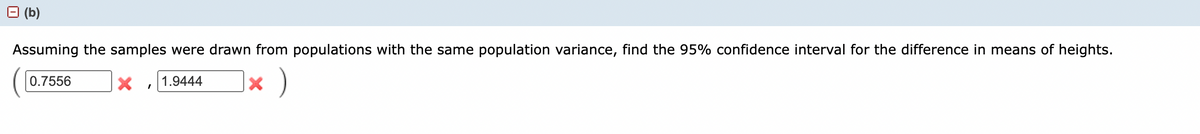
Transcribed Image Text:) (b)
Assuming the samples were drawn from populations with the same population variance, find the 95% confidence interval for the difference in means of heights.
)
0.7556
1.9444
Expert Solution
This question has been solved!
Explore an expertly crafted, step-by-step solution for a thorough understanding of key concepts.

This is a popular solution!

Trending now
This is a popular solution!

Step by step
Solved in 2 steps with 2 images

Recommended textbooks for you
Algebra & Trigonometry with Analytic Geometry
Algebra
ISBN:
9781133382119
Author:
Swokowski
Publisher:
Cengage

College Algebra (MindTap Course List)
Algebra
ISBN:
9781305652231
Author:
R. David Gustafson, Jeff Hughes
Publisher:
Cengage Learning

Algebra: Structure And Method, Book 1
Algebra
ISBN:
9780395977224
Author:
Richard G. Brown, Mary P. Dolciani, Robert H. Sorgenfrey, William L. Cole
Publisher:
McDougal Littell
Algebra & Trigonometry with Analytic Geometry
Algebra
ISBN:
9781133382119
Author:
Swokowski
Publisher:
Cengage
College Algebra (MindTap Course List)
Algebra
ISBN:
9781305652231
Author:
R. David Gustafson, Jeff Hughes
Publisher:
Cengage Learning
Algebra: Structure And Method, Book 1
Algebra
ISBN:
9780395977224
Author:
Richard G. Brown, Mary P. Dolciani, Robert H. Sorgenfrey, William L. Cole
Publisher:
McDougal Littell