Law enforcement agencies in Charlotte, NC conduct an average of 120,000 traffic stops per year. By law, the agencies collect information about all traffic stops, the reason for the stop, and the type of enforcement action taken. A random sample of 300 traffic stops revealed that 57 of the drivers were under 25 years of age. A total of 198 were issued a citation while the rest were given a verbal or written warning. A total of 40 drivers were under 25 years of age and issued a citation. 1. Use this information to complete the contingency table below. Age Citation Warning Total Under 25 25 or older Total 2. What type of a study is this? O A. Experiment O B. Observational Study 3. Compute the difference in the proportions of drivers who received citation in the two groups: Punder25 - Pover2s . Round your result to four decimal places. 4. Insurance rates are usually higher for drivers under the age of 25. Which set of hypotheses would we use to test whether this was justified? O A. Ho : Younger drivers are less likely to receive citations when stopped for speeding HA: The difference in citation rates between younger and older drivers is due to chance. O B. Ho : Younger drivers are more likely to receive citations when stopped for speeding. H: The difference in citation rates between younger and older drivers is due to chance. O C. Ho : The difference in citation rates between younger and older drivers is due to chance. HA: Younger drivers are less likely to receive citations when stopped for speeding.
Law enforcement agencies in Charlotte, NC conduct an average of 120,000 traffic stops per year. By law, the agencies collect information about all traffic stops, the reason for the stop, and the type of enforcement action taken. A random sample of 300 traffic stops revealed that 57 of the drivers were under 25 years of age. A total of 198 were issued a citation while the rest were given a verbal or written warning. A total of 40 drivers were under 25 years of age and issued a citation. 1. Use this information to complete the contingency table below. Age Citation Warning Total Under 25 25 or older Total 2. What type of a study is this? O A. Experiment O B. Observational Study 3. Compute the difference in the proportions of drivers who received citation in the two groups: Punder25 - Pover2s . Round your result to four decimal places. 4. Insurance rates are usually higher for drivers under the age of 25. Which set of hypotheses would we use to test whether this was justified? O A. Ho : Younger drivers are less likely to receive citations when stopped for speeding HA: The difference in citation rates between younger and older drivers is due to chance. O B. Ho : Younger drivers are more likely to receive citations when stopped for speeding. H: The difference in citation rates between younger and older drivers is due to chance. O C. Ho : The difference in citation rates between younger and older drivers is due to chance. HA: Younger drivers are less likely to receive citations when stopped for speeding.

Glencoe Algebra 1, Student Edition, 9780079039897, 0079039898, 2018
18th Edition
ISBN:9780079039897
Author:Carter
Publisher:Carter
Chapter10: Statistics
Section10.6: Summarizing Categorical Data
Problem 13CYU

Related questions
Topic Video
Question
can i get some help with those two problems
thank you
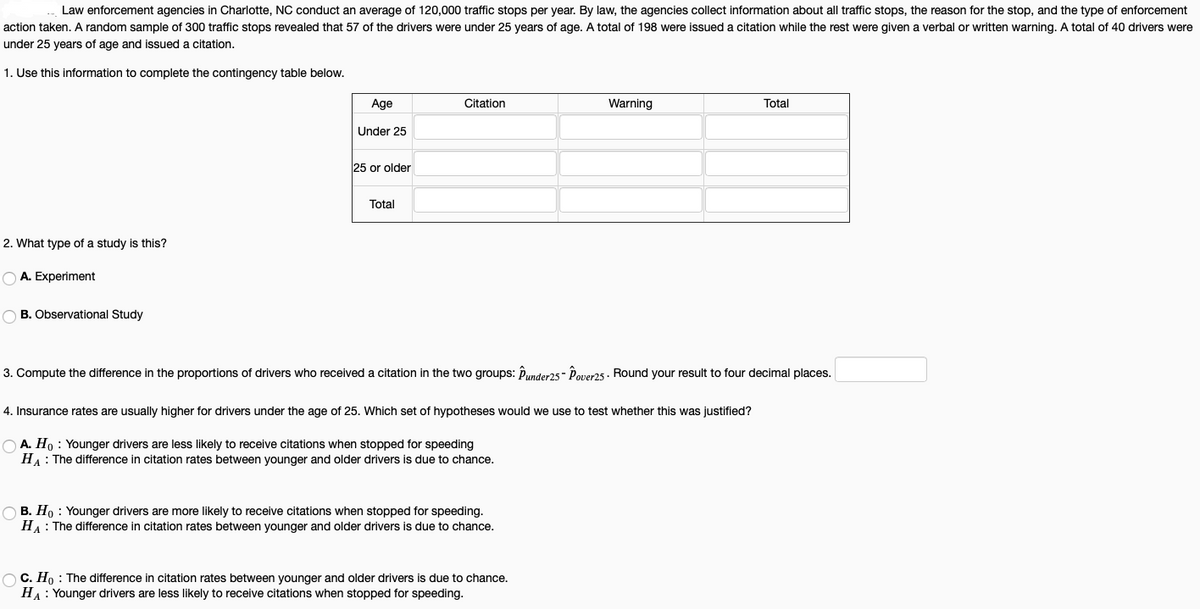
Transcribed Image Text:Law enforcement agencies in Charlotte, NC conduct an average of 120,000 traffic stops per year. By law, the agencies collect information about all traffic stops, the reason for the stop, and the type of enforcement
action taken. A random sample of 300 traffic stops revealed that 57 of the drivers were under 25 years of age. A total of 198 were issued a citation while the rest were given a verbal or written warning. A total of 40 drivers were
under 25 years of age and issued a citation.
1. Use this information to complete the contingency table below.
Age
Citation
Warning
Total
Under 25
25 or older
Total
2. What type of a study is this?
O A. Experiment
O B. Observational Study
3. Compute the difference in the proportions of drivers who received a citation in the two groups: Punder25- Pover25. Round your result to four decimal places.
4. Insurance rates are usually higher for drivers under the age of 25. Which set of hypotheses would we use to test whether this was justified?
O A. Ho : Younger drivers are less likely to receive citations when stopped for speeding
HA: The difference in citation rates between younger and older drivers is due to chance.
O B. Ho : Younger drivers are more likely to receive citations when stopped for speeding.
HA: The difference in citation rates between younger and older drivers is due to chance.
O C. Ho : The difference in citation rates between younger and older drivers is due to chance.
HA: Younger drivers are less likely to receive citations when stopped for speeding.
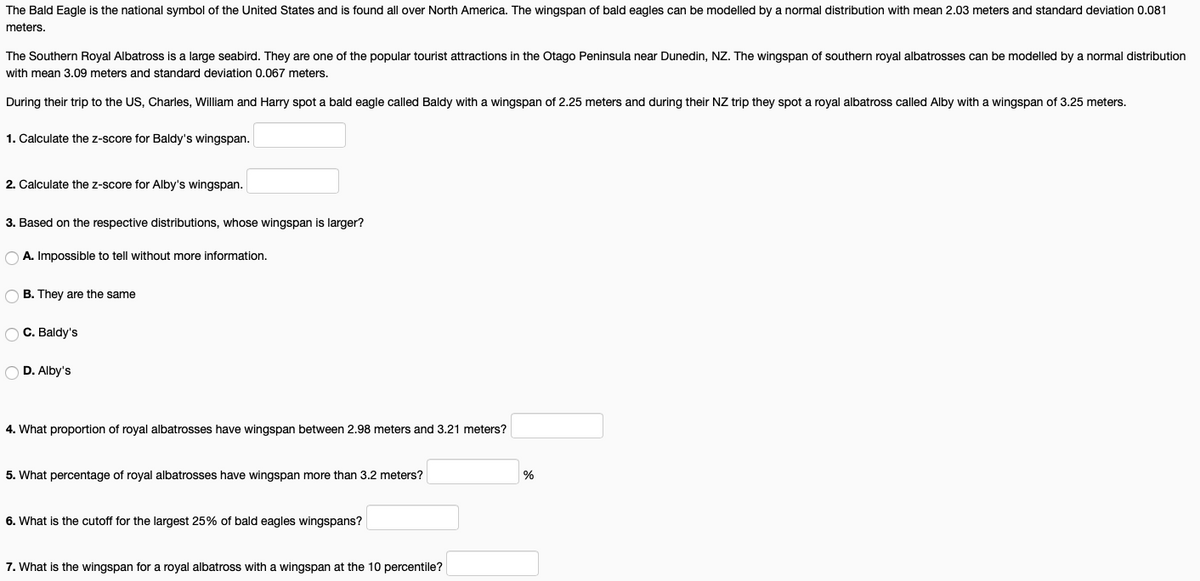
Transcribed Image Text:The Bald Eagle is the national symbol of the United States and is found
over North America. The wingspan of bald eagles can be modelled by a normal distribution with mean 2.03 meters and standard deviation 0.081
meters.
The Southern Royal Albatross is a large seabird. They are one of the popular tourist attractions in the Otago Peninsula near Dunedin, NZ. The wingspan of southern royal albatrosses can be modelled by a normal distribution
with mean 3.09 meters and standard deviation 0.067 meters.
During their trip to the US, Charles, William and Harry spot a bald eagle called Baldy with a wingspan of 2.25 meters and during their NZ trip they spot a royal albatross called Alby with a wingspan of 3.25 meters.
1. Calculate the z-score for Baldy's wingspan.
2. Calculate the z-score for Alby's wingspan.
3. Based on the respective distributions, whose wingspan is larger?
O A. Impossible to tell without more information.
O B. They are the same
O C. Baldy's
O D. Alby's
4. What proportion of royal albatrosses have wingspan between 2.98 meters and 3.21 meters?
5. What percentage of royal albatrosses have wingspan more than 3.2 meters?
%
6. What is the cutoff for the largest 25% of bald eagles wingspans?
7. What is the wingspan for a royal albatross with a wingspan at the 10 percentile?
Expert Solution
This question has been solved!
Explore an expertly crafted, step-by-step solution for a thorough understanding of key concepts.

This is a popular solution!

Trending now
This is a popular solution!

Step by step
Solved in 2 steps

Knowledge Booster


Learn more about
Need a deep-dive on the concept behind this application? Look no further. Learn more about this topic, statistics and related others by exploring similar questions and additional content below.Recommended textbooks for you
Glencoe Algebra 1, Student Edition, 9780079039897…
Algebra
ISBN:
9780079039897
Author:
Carter
Publisher:
McGraw Hill

Holt Mcdougal Larson Pre-algebra: Student Edition…
Algebra
ISBN:
9780547587776
Author:
HOLT MCDOUGAL
Publisher:
HOLT MCDOUGAL
Glencoe Algebra 1, Student Edition, 9780079039897…
Algebra
ISBN:
9780079039897
Author:
Carter
Publisher:
McGraw Hill
Holt Mcdougal Larson Pre-algebra: Student Edition…
Algebra
ISBN:
9780547587776
Author:
HOLT MCDOUGAL
Publisher:
HOLT MCDOUGAL