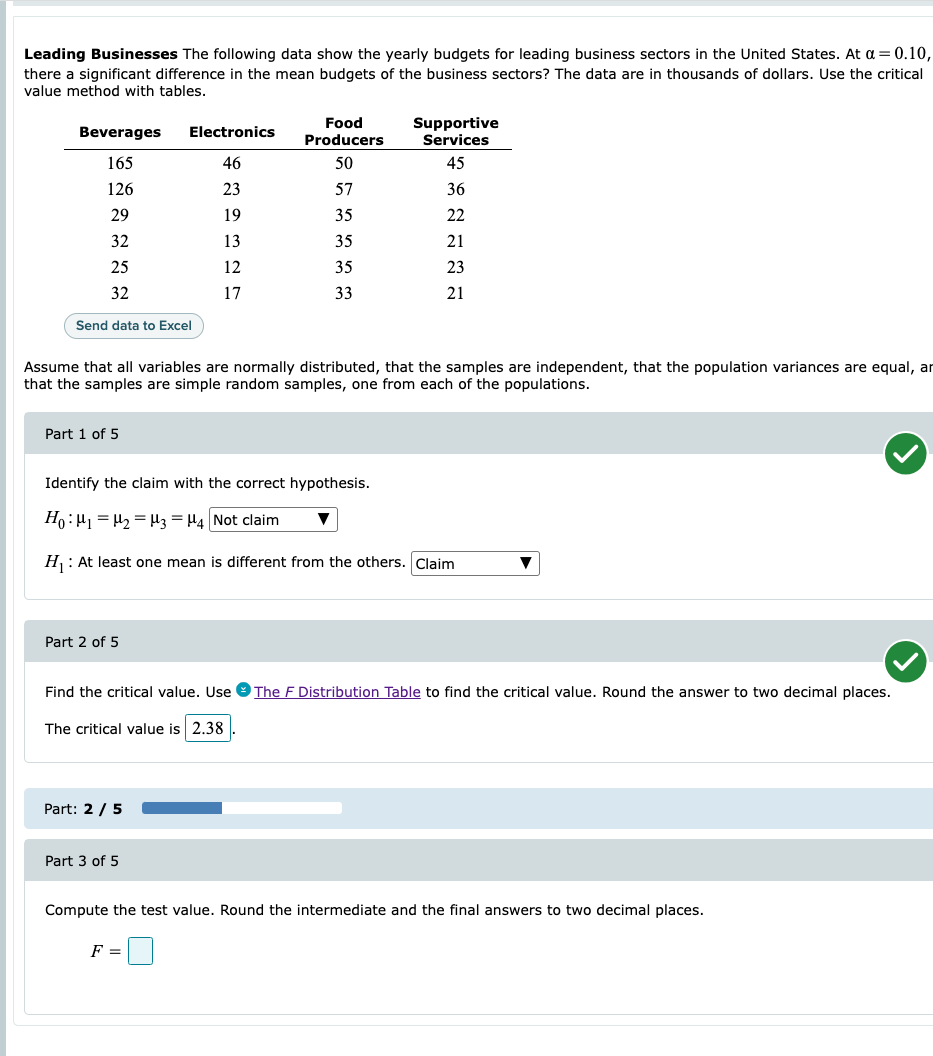
Leading Businesses The following data show the yearly budgets for leading business sectors in the United States. At a = 0.10, there a significant difference in the mean budgets of the business sectors? The data are in thousands of dollars. Use the critical value method with tables. Beverages 165 126 29 32 25 32 Send data to Excel Part 1 of 5 Part 2 of 5 Electronics 46 23 19 13 12 17 Assume that all variables are normally distributed, that the samples are independent, that the population variances are equal, ar that the samples are simple random samples, one from each of the populations. Part: 2 / 5 Food Producers 50 Identify the claim with the correct hypothesis. H₁ H₁ H₂ H3 H4 Not claim H₁: At least one mean is different from the others. Claim Part 3 of 5 57 35 35 35 33 Supportive Services 45 36 22 21 23 21 Find the critical value. Use The F Distribution Table to find the critical value. Round the answer to two decimal places. The critical value is 2.38 F = Compute the test value. Round the intermediate and the final answers to two decimal places.
Leading Businesses The following data show the yearly budgets for leading business sectors in the United States. At a = 0.10, there a significant difference in the mean budgets of the business sectors? The data are in thousands of dollars. Use the critical value method with tables. Beverages 165 126 29 32 25 32 Send data to Excel Part 1 of 5 Part 2 of 5 Electronics 46 23 19 13 12 17 Assume that all variables are normally distributed, that the samples are independent, that the population variances are equal, ar that the samples are simple random samples, one from each of the populations. Part: 2 / 5 Food Producers 50 Identify the claim with the correct hypothesis. H₁ H₁ H₂ H3 H4 Not claim H₁: At least one mean is different from the others. Claim Part 3 of 5 57 35 35 35 33 Supportive Services 45 36 22 21 23 21 Find the critical value. Use The F Distribution Table to find the critical value. Round the answer to two decimal places. The critical value is 2.38 F = Compute the test value. Round the intermediate and the final answers to two decimal places.

Glencoe Algebra 1, Student Edition, 9780079039897, 0079039898, 2018
18th Edition
ISBN:9780079039897
Author:Carter
Publisher:Carter
Chapter10: Statistics
Section10.4: Distributions Of Data
Problem 20PFA

Related questions
Question
Part 4 Do you reject/not reject the null hypothesis?
Transcribed Image Text:Leading Businesses The following data show the yearly budgets for leading business sectors in the United States. At a = 0.10,
there a significant difference in the mean budgets of the business sectors? The data are in thousands of dollars. Use the critical
value method with tables.
Beverages
165
126
29
32
25
32
Send data to Excel
Part 1 of 5
Part 2 of 5
Electronics
46
23
19
13
12
17
Assume that all variables are normally distributed, that the samples are independent, that the population variances are equal, ar
that the samples are simple random samples, one from each of the populations.
Part: 2 / 5
Food
Producers
50
57
35
35
35
33
Identify the claim with the correct hypothesis.
H₁ H₁ H₂ H3 H4 Not claim
=
H₁: At least one mean is different from the others. Claim
Part 3 of 5
Supportive
Services
45
36
22
21
23
21
Find the critical value. Use The F Distribution Table to find the critical value. Round the answer to two decimal places.
The critical value is 2.38
F =
Compute the test value. Round the intermediate and the final answers to two decimal places.
Expert Solution
This question has been solved!
Explore an expertly crafted, step-by-step solution for a thorough understanding of key concepts.

This is a popular solution!

Trending now
This is a popular solution!

Step by step
Solved in 3 steps with 1 images

Recommended textbooks for you
Glencoe Algebra 1, Student Edition, 9780079039897…
Algebra
ISBN:
9780079039897
Author:
Carter
Publisher:
McGraw Hill
Glencoe Algebra 1, Student Edition, 9780079039897…
Algebra
ISBN:
9780079039897
Author:
Carter
Publisher:
McGraw Hill