Least-squares OK? Following is a residual plot produced by MINITAB. Was it appropriate to compute the least-squares regressl line? Explain. Residuals Versus x (response is y) 0.2 0.1 0.0 -0.1 -0.2 10 15 20 Residual
Least-squares OK? Following is a residual plot produced by MINITAB. Was it appropriate to compute the least-squares regressl line? Explain. Residuals Versus x (response is y) 0.2 0.1 0.0 -0.1 -0.2 10 15 20 Residual

Big Ideas Math A Bridge To Success Algebra 1: Student Edition 2015
1st Edition
ISBN:9781680331141
Author:HOUGHTON MIFFLIN HARCOURT
Publisher:HOUGHTON MIFFLIN HARCOURT
Chapter4: Writing Linear Equations
Section4.5: Analyzing Lines Of Fit
Problem 7E

Related questions
Question
Use the residual plot in order to choose which option is true in the brackets. (yes or no), it (was or was not) appropriate to compute the least-squares regression line because the residual plot (exhibits or does not exhibit) a noticeable pattern.
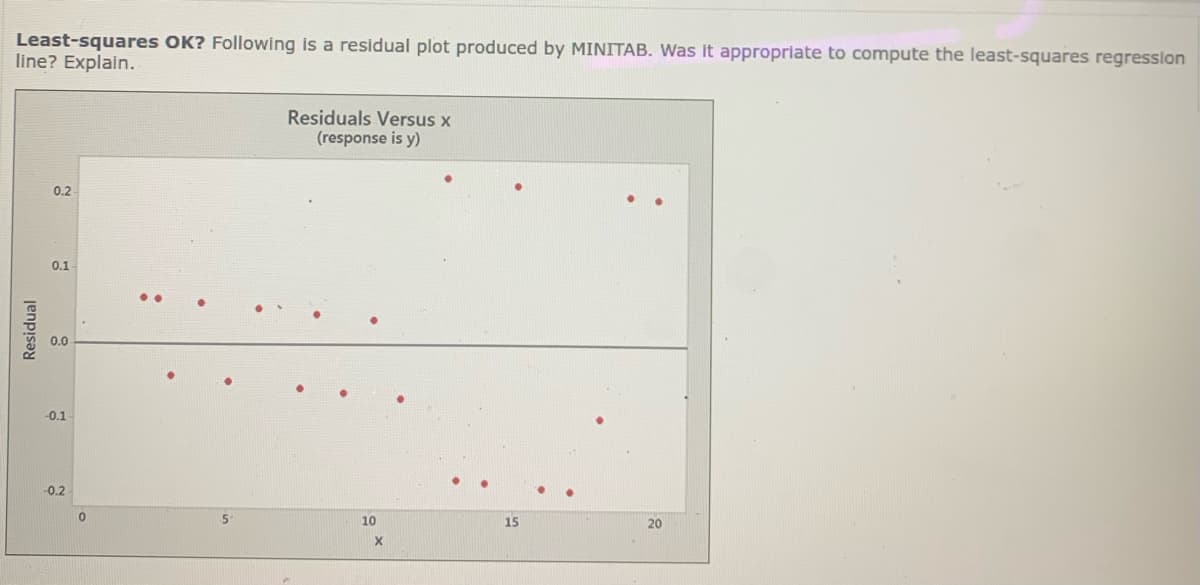
Transcribed Image Text:Least-squares OK? Following is a residual plot produced by MINITAB. Was it appropriate to compute the least-squares regression
line? Explain.
Residuals Versus x
(response is y)
0.2
0.1
0.0
-0.1
-0.2
10
15
20
Residual
Expert Solution
This question has been solved!
Explore an expertly crafted, step-by-step solution for a thorough understanding of key concepts.

This is a popular solution!

Trending now
This is a popular solution!

Step by step
Solved in 2 steps with 1 images

Recommended textbooks for you
Big Ideas Math A Bridge To Success Algebra 1: Stu…
Algebra
ISBN:
9781680331141
Author:
HOUGHTON MIFFLIN HARCOURT
Publisher:
Houghton Mifflin Harcourt


Glencoe Algebra 1, Student Edition, 9780079039897…
Algebra
ISBN:
9780079039897
Author:
Carter
Publisher:
McGraw Hill
Big Ideas Math A Bridge To Success Algebra 1: Stu…
Algebra
ISBN:
9781680331141
Author:
HOUGHTON MIFFLIN HARCOURT
Publisher:
Houghton Mifflin Harcourt
Glencoe Algebra 1, Student Edition, 9780079039897…
Algebra
ISBN:
9780079039897
Author:
Carter
Publisher:
McGraw Hill

Functions and Change: A Modeling Approach to Coll…
Algebra
ISBN:
9781337111348
Author:
Bruce Crauder, Benny Evans, Alan Noell
Publisher:
Cengage Learning

Algebra & Trigonometry with Analytic Geometry
Algebra
ISBN:
9781133382119
Author:
Swokowski
Publisher:
Cengage

Elementary Linear Algebra (MindTap Course List)
Algebra
ISBN:
9781305658004
Author:
Ron Larson
Publisher:
Cengage Learning