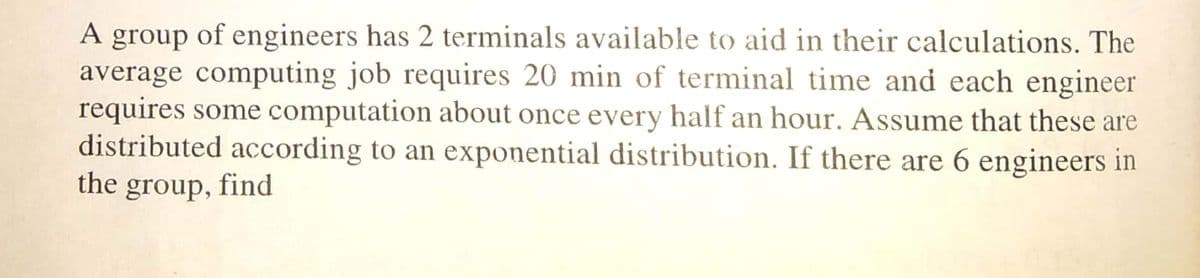
(a) the expected number of engineers waiting to use one of the terminals and in the computing centre and


Q: 5. Based on the given data, calculate: 2.2, 2.3, 2.1, 2.4, 2.1, 2.2, 2.6 1. The mean 11. The median ...
A:
Q: Find each of the shaded areas under the standard normal curve using a TI-84 calculator. Round the an...
A:
Q: If n = 13, T=30, and s = 3, construct a confidence interval at a 99% confidence level. Give your ans...
A:
Q: A psychiatrist is interested in finding a 98% confidence interval for the tics per hour exhibited by...
A: Given data is 0,0,6,12,8,11,0,1,9,4,1,8,11,0,6sample size(n)=15confidence interval = 98%
Q: Stress at work: In a poll about work, 45% of respondents said that their jobs were sometimes or alwa...
A:
Q: Using the TI-84 calculator, find the area under the standard normal curve that lies between the foll...
A: To find the area under the standard normal curve that lies between the following z-values:
Q: () I Example 69. The geometric mean of 10 observations of a certain variable was calculated as 16.2....
A:
Q: The height of a certain type of palm tree is normally distributed with mean 45 feet and standard dev...
A: The height is normally distributed with a mean 45 and a standard deviation of 10.
Q: (a) Given the following f (x), compute Var(X). 0.2; x = 0 0.8 ; x = 1 0; otherwise f(x) = %3D (b) Gi...
A: I solved exactly first three subparts because of bartleby policy if you want more please upload sepa...
Q: Mean= 100 and standard deviation=10, what is probability of x110
A:
Q: * (i) Let X,, .... X, be a random sample from the distribution with the PDF S(x: 0) = 2.r for 0<x<0....
A:
Q: hoose the variable that is likely to be negatively correlated with the sale price of a new electric ...
A: The correlation coefficient is computed by the researcher to identify the kind of relationship that ...
Q: Using a TI-84 calculator, find the area under the standard normal curve to the left of the following...
A:
Q: How many 3-digit numbers can we make using the digits 2, 3, 4, 5, and 6 without repetitions?
A: here available digit 2,3,4,5 and 6 total 5 digits available
Q: Compare the weights of males and females based on the boxplots. You must discuss at least two differ...
A: For female, the median is closer to third quartile so the data is right skewed. There are only 3 ou...
Q: (i) Construct a table to clearly show your class boundaries and cumulative frequency. (ii) Construct...
A: Data is given for Annual salary and number of graduates. We have to calculate class boundaries, cumu...
Q: 14. The formula for Chi Square (x) is: x = chi squared x² = 0 - E)? O = observed value E; E = expect...
A: Given that, put 270 corn kernels, 90 rice grains, 90 mongo seeds and 30 squash seeds into a containe...
Q: 2. A certain number of salesmen were appointed in different territories and the following data were ...
A: Data table: Xi: frequency (f) 22 4 27 5 32 12 37 23 42 31 47 10 52 8 57 5 62 2
Q: Chi-Square distribution having one (1) degree of freedom will be asymptotic on x-axis only
A: Here use graph of chi square distribution with df =1
Q: ) Consider the model y, = B, + B,x, + B,x + €,. for Isisn, where x,, .. . , are given values, with x...
A:
Q: Between the hours 2 pm and 4 pm, the average number of phone calls per minute coming into the switch...
A:
Q: Calculate the index number using both the Aggregate Expenditure Method and Family Budget Method for ...
A: Solution is given:
Q: The weights that are used in calculating a weighted mean will vary depending on the situation.
A:
Q: 2. The frequency distribution for the systolic blood pressure readings (mmHg) of 200 randomly select...
A:
Q: Given that the switchboard of consultant's office receives on the average 0.9 calls per minute, find...
A:
Q: When is the unexplained variation (that is, error sum of squares) equal to 0? Choose the correct cho...
A: The error sum of squares is equal to zero when,
Q: The average return of a risky portfolio is 10.5% per year with a stan- dard deviation of 18%. If ret...
A:
Q: Bottle Number 1 2 3 4 5 6 7 8 9 10 Milliliters 347 356 340 350 347 354 351 340 342 358 Bottle Number...
A:
Q: 7. Many businesses have music piped into the work areas to improve the environment. At a company an ...
A: Given: Country Rock Classical 857 791 824 801 753 847 795 781 881 842 776 865
Q: Mr. X wants to determine on the basis of sample study the mean time required to complete a certain j...
A:
Q: Using the TI-84 calculator, find the area under the standard normal curve that lies between the foll...
A:
Q: In statistics, we come across problems such as measures of positions, measures or center, and measur...
A:
Q: Given the following data: 8 10 15 8 6 9 1 1 15 Obtain the two regression equations and calculate Sta...
A: Solution is given:
Q: For the Toy Car table above, what are the Planned Order Receipts in the week of 8/31? Number For the...
A: From the table we have 1.700 2.2500 3.3200 4.1750 5.400 6.0 7.3150 8.2100
Q: Tolerance Interval is narrower compared with the confidence interval for µ O True False
A:
Q: Regression Statistics Multiple R R Square Adjusted R Square 0.707 Standard Error Observations ANOVA ...
A: r2 is coefficient of determination, Here total observations, n= 8 k= 2 Given that, r2adjusted = 0...
Q: Suppose we believe that the life length 'T (in hours) of light bulb is exponentially distributed wit...
A:
Q: * (i) State and prove the factorisation criterion for sufficient statistics, in the Case or discrete...
A:
Q: The following data gives the speeds of 15 cars, measured by radar, traveling on a certain highway. 7...
A:
Q: a. Determine the crude birth rate (per 1,000) in the Philippines in 1985. b. Determine the crude dea...
A: Given the data as Population Counts in the Philippines, 1985 Total Males 27,437,246 Total Fem...
Q: In the context of the paper by Hasanhodzic and Lo (2007), how do the authors account for the fact th...
A:
Q: A random sample of 34 cases is selected from this population. i. Determine the expected value and va...
A:
Q: Find each of the shaded areas under the standard normal curve using a TI-84 calculator. Round the an...
A: To find area of shaded region i.e area below the z=-0.38 from standard normal distribution ?
Q: Pain: A recent survey asked 830 people how many days they would walt to seek medical treatment if th...
A: Required probability is P(person wait for 2 days)
Q: Q8.3 Mean and Median 1 Point Suppose we measure GPA for people in our class, we find the mean is 2.8...
A: Solution-: Q 8.3 Suppose we assume GPA for people in our class. We find the mean is 2.8 and median i...
Q: The mean BMI in patients free of diabetes has been reported as 27.8. An investigator measured BMI in...
A:
Q: When is the mean a poor description of a frequency distribution? O When the distribution has a small...
A: Mean : A data set's mean is used to summarise it. It's a metric for determining where a data set's c...
Q: You run a PPM correlation on sprint speed and vertical jump height in NFL running backs and find an ...
A:
Q: acuum tube in a sonar scanning device. Based on past experience, the vacuum tube exhibits the follow...
A: * SOLUTION :-
Q: V. Find the variance and standard deviation. Show your solution. 1 0.19 P(x) 0.09 0.39 0.22 0.11
A: Let X be the random variable having probability mass function is, X 0 1 2 3 4 P(X) 0.09 0.19 ...


Step by step
Solved in 2 steps with 2 images

- The estimated model was Theft = β0 + β1caught + β2penalty + β3gender + β4Income + β5Edu Provide an explanation of the expected signs of each of the coefficients, referring to relevant economic theory.Suppose that a researcher is interested in the average standardized test score for fifth graders in a local school district. The fifth graders at a specific school would comprise a ___________ and their average test score would be a ___________.2. A leading researcher in the study of interstate highway accidents proposes that a major cause of many collisions on the interstates is not the speed of the vehicles but rather the difference in speeds of the vehicles. When some vehicles are traveling slowly while other vehicles are traveling at speeds greatly in excess of the speed limit, the faster-moving vehicles may have to change lanes quickly, which can increase the chance of an accident. Thus, when there is a large variation in the speeds of the vehicles in a given location on the interstate, there may be a larger number of accidents than when the traffic is moving at a more uniform speed. The researcher believes that when the standard deviation in speed of vehicles exceeds 10 mph, the rate of accidents is greatly increased. During a 1-hour period of time, a random sample of 50 vehicles is selected from a section of an interstate known to have a high rate of accidents, and their speeds are recorded using a radar gun. The data…
- If there is no seasonal effect on people getting sick, we would expect equal numbers of people getting sick in each season (winter, spring, summer and fall). A student takes a census of students who took Marketing Research in 2019 and finds that of the 280 students who took Marketing Research in 2019, 75 were sick in winter, 65 were sick in spring, 68 were sick in summer and 72 were sick in fall. She wonders if the excess in the winter is an indication that sickness rates are not uniform throughout the year. Perform the appropriate chi-square test and indicate the chi-square value below. (Report two decimals)The 2019-2020 flu season was especially tough. By the end of the season, an estimated total of 49 million people in the United States had contracted the flu, of whom an estimated 79,000 died from the flu. Assume that the US population was 300,000,000 during the 2019-2020 flu season and that during the season, a total of 2.9 million Americans died from all causes (including the flu). Assume the population of the US remained the same at the midpoint of the season. Report mortality rates per 100,000. Be sure to express the measure in the correct format. a.What was the proportionate mortality rate from flu during the 2019-2020 flu season? b.What was the case fatality rate from flue during the 2019-2020 flu season?The 2019-2020 flu season was especially tough.By the end of the season, an estimated total of 49 million people in the United States had contracted the flu, of whom an estimated 79,000 died from the flu. Assume that the US population was 300,000,000 during the 2019-2020 flu season and that during the season, a total of 2.9 million Americans died from all causes (including the flu). Assume the population of the US remained the same at the midpoint of the season. Report mortality rates per 100,000. Be sure to express the measure in the correct format. c.What was the flu-related mortality rate during the 2019-2020 flu season? d.What is the all-cause mortality rate during the 2019-2020 flu season? e.In a country with an age distribution that is much younger than in the US, the proportionate mortality rate from flu in 2019 was 5%. Based on this information alone, can we determine that the risk of dying from flu in 2019 was higher in this country compared to the US? Why or why not?
- If the price of a piece of tuperware having capacity X is given by 60X-545, what is the expected price paid by the next customer to buy a piece of tuperware?In an M/M/1 queueing system, the arrival rate is 9 customers per hour and the service rate is 12 customers per hour. What is the utilization? (Round your answer to 3 decimal places.) 2. What is the expected number of customers in the system (L)? (Round your answer to 3 decimal places.) 3. What is the expected waiting time in the system (W)? (Express the waiting time in hours, round your answer to 3 decimal places.) 4. What is the expected number of customers in the queue(Lq)? (Round your answer to 3 decimal places.) 5. What is the expected waiting time in the queue(Wq)? (Express the waiting time in hours, round your answer to 3 decimal places.)