Let a population consist of the values 10 cigarettes, 11 cigarettes, and 20 cigarettes smoked in a day. Show that when samples of size 2 are randomly selected with replacement, the samples have mean absolute deviations that do not center about the value of the mean absolu deviation of the population. What does this indicate about a sample mean absolute deviation being used as an estimator of the mean absolute deviation of a population? Calculate the mean absolute deviation for each possible sample of size 2 from the population. Mean Absolute Deviation Sample (10,10) (10,11) (10,20) (11,10) (11,11) (11,20) (20,10) (20,11) (20,20) (Type integers or decimals rounded to one decimal place as needed.) Calculate the mean of the sample mean absolute deviations. The mean of the sample mean absolute deviations is (Type an integer or decimal rounded to one decimal place as needed.) Calculate the population mean absolute deviation. The population mean absolute deviation is (Type an integer or decimal rounded to one decimal place as needed.) What do these values indicate about a sample mean absolute deviation being used as an estimator of the mean absolute deviation of a population? O A. The sample mean absolute deviation is a biased estimator of the population mean absolute deviation because the sample statistic centers around a different value than the population parameter. OB. The sample mean absolute deviation is an unbiased estimator of the population mean absolute deviation because the sample statistic centers around the mean value of the population. O C. The sample mean absolute deviation is a biased estimator of the population mean absolute deviation because the sample statistic centers around the mean value of the population.
Let a population consist of the values 10 cigarettes, 11 cigarettes, and 20 cigarettes smoked in a day. Show that when samples of size 2 are randomly selected with replacement, the samples have mean absolute deviations that do not center about the value of the mean absolu deviation of the population. What does this indicate about a sample mean absolute deviation being used as an estimator of the mean absolute deviation of a population? Calculate the mean absolute deviation for each possible sample of size 2 from the population. Mean Absolute Deviation Sample (10,10) (10,11) (10,20) (11,10) (11,11) (11,20) (20,10) (20,11) (20,20) (Type integers or decimals rounded to one decimal place as needed.) Calculate the mean of the sample mean absolute deviations. The mean of the sample mean absolute deviations is (Type an integer or decimal rounded to one decimal place as needed.) Calculate the population mean absolute deviation. The population mean absolute deviation is (Type an integer or decimal rounded to one decimal place as needed.) What do these values indicate about a sample mean absolute deviation being used as an estimator of the mean absolute deviation of a population? O A. The sample mean absolute deviation is a biased estimator of the population mean absolute deviation because the sample statistic centers around a different value than the population parameter. OB. The sample mean absolute deviation is an unbiased estimator of the population mean absolute deviation because the sample statistic centers around the mean value of the population. O C. The sample mean absolute deviation is a biased estimator of the population mean absolute deviation because the sample statistic centers around the mean value of the population.

MATLAB: An Introduction with Applications
6th Edition
ISBN:9781119256830
Author:Amos Gilat
Publisher:Amos Gilat
Chapter1: Starting With Matlab
Section: Chapter Questions
Problem 1P

Related questions
Question
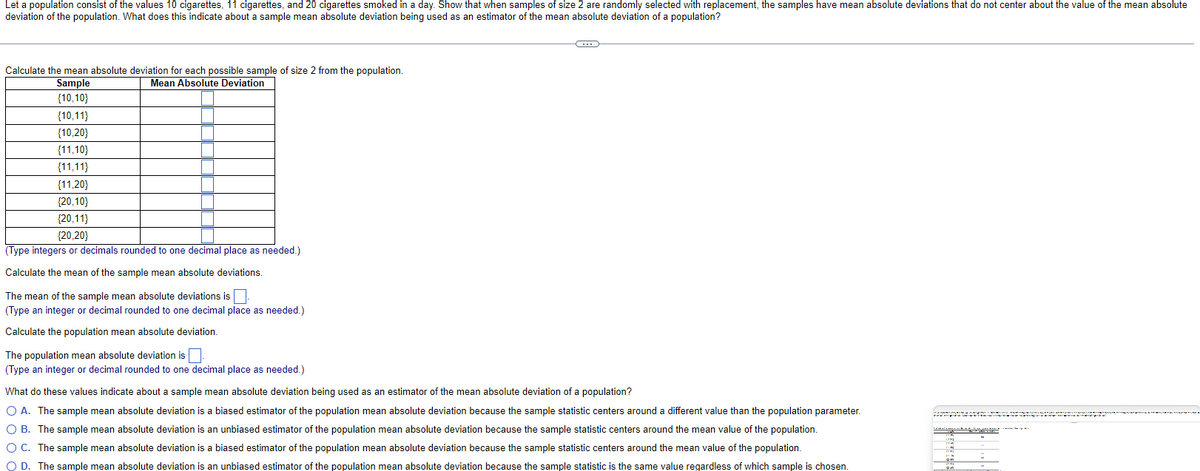
Transcribed Image Text:Let a population consist of the values 10 cigarettes, 11 cigarettes, and 20 cigarettes smoked in a day. Show that when samples of size 2 are randomly selected with replacement, the samples have mean absolute deviations that do not center about the value of the mean absolute
deviation of the population. What does this indicate about a sample mean absolute deviation being used as an estimator of the mean absolute deviation of a population?
Calculate the mean absolute deviation for each possible sample of size 2 from the population.
Mean Absolute Deviation
Sample
{10,10}
{10,11)
{10,20}
{11,10}
(11,11}
{11,20}
{20,10}
{20,11}
{20,20}
(Type integers or decimals rounded to one decimal place as needed.)
Calculate the mean of the sample mean absolute deviations.
The mean of the sample mean absolute deviations is
(Type an integer or decimal rounded to one decimal place as needed.)
Calculate the population mean absolute deviation.
The population mean absolute deviation is.
(Type an integer or decimal rounded to one decimal place as needed.)
G
What do these values indicate about a sample mean absolute deviation being used as an estimator of the mean absolute deviation of a population?
O A. The sample mean absolute deviation is a biased estimator of the population mean absolute deviation because the sample statistic centers around a different value than the population parameter.
O B. The sample mean absolute deviation is an unbiased estimator of the population mean absolute deviation because the sample statistic centers around the mean value of the population.
O C. The sample mean absolute deviation is a biased estimator of the population mean absolute deviation because the sample statistic centers around the mean value of the population.
O D. The sample mean absolute deviation is an unbiased estimator of the population mean absolute deviation because the sample statistic is the same value regardless of which sample is chosen.
CA
Expert Solution
This question has been solved!
Explore an expertly crafted, step-by-step solution for a thorough understanding of key concepts.

This is a popular solution!

Trending now
This is a popular solution!

Step by step
Solved in 2 steps

Recommended textbooks for you
MATLAB: An Introduction with Applications
Statistics
ISBN:
9781119256830
Author:
Amos Gilat
Publisher:
John Wiley & Sons Inc

Probability and Statistics for Engineering and th…
Statistics
ISBN:
9781305251809
Author:
Jay L. Devore
Publisher:
Cengage Learning

Statistics for The Behavioral Sciences (MindTap C…
Statistics
ISBN:
9781305504912
Author:
Frederick J Gravetter, Larry B. Wallnau
Publisher:
Cengage Learning
MATLAB: An Introduction with Applications
Statistics
ISBN:
9781119256830
Author:
Amos Gilat
Publisher:
John Wiley & Sons Inc
Probability and Statistics for Engineering and th…
Statistics
ISBN:
9781305251809
Author:
Jay L. Devore
Publisher:
Cengage Learning
Statistics for The Behavioral Sciences (MindTap C…
Statistics
ISBN:
9781305504912
Author:
Frederick J Gravetter, Larry B. Wallnau
Publisher:
Cengage Learning

Elementary Statistics: Picturing the World (7th E…
Statistics
ISBN:
9780134683416
Author:
Ron Larson, Betsy Farber
Publisher:
PEARSON

The Basic Practice of Statistics
Statistics
ISBN:
9781319042578
Author:
David S. Moore, William I. Notz, Michael A. Fligner
Publisher:
W. H. Freeman

Introduction to the Practice of Statistics
Statistics
ISBN:
9781319013387
Author:
David S. Moore, George P. McCabe, Bruce A. Craig
Publisher:
W. H. Freeman