Let function f interpreted as a picture below. True statement for function fis ... Pernyataan yang benar untuk grafik fungsi f di bawah ini adalah ... y 2 Ax) lim f(x) = 0 x→1 1. O lim f(x) = 2 x→1- 2. O lim f(x) = 2 X→1 3. O lim f(x) = 2 x→1+ 4. O
Let function f interpreted as a picture below. True statement for function fis ... Pernyataan yang benar untuk grafik fungsi f di bawah ini adalah ... y 2 Ax) lim f(x) = 0 x→1 1. O lim f(x) = 2 x→1- 2. O lim f(x) = 2 X→1 3. O lim f(x) = 2 x→1+ 4. O

Chapter3: Functions
Section3.3: Rates Of Change And Behavior Of Graphs
Problem 2SE: If a functionfis increasing on (a,b) and decreasing on (b,c) , then what can be said about the local...

Related questions
Question
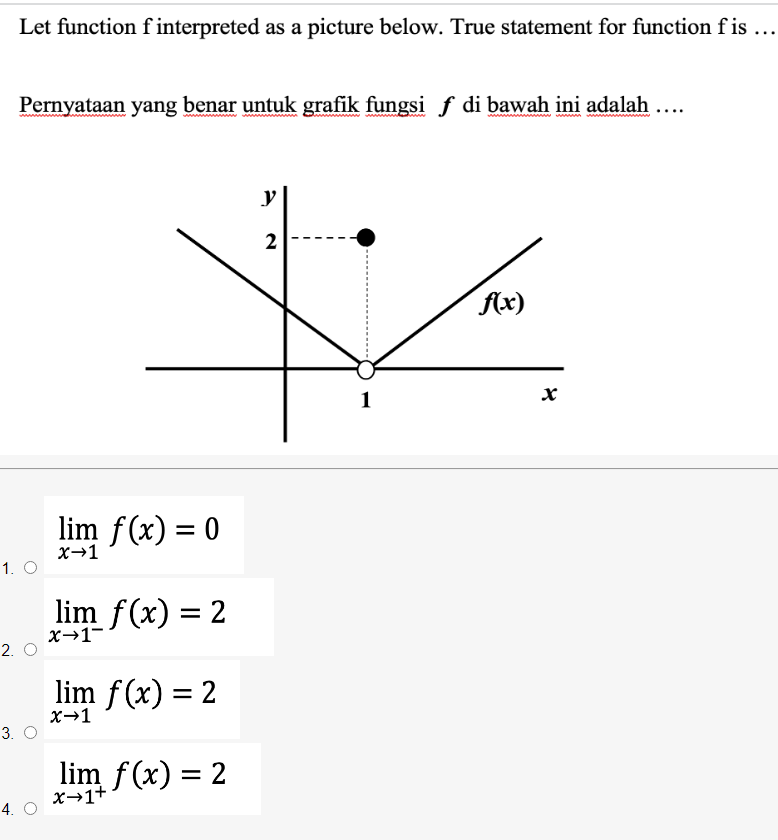
Transcribed Image Text:Let function f interpreted as a picture below. True statement for function fis ...
Pernyataan yang benar untuk grafik fungsi f di bawah ini adalah ...
y
2
Ax)
lim f(x) = 0
x→1
1. O
lim f(x) = 2
x→1-
2. O
lim f(x) = 2
X→1
3. O
lim f(x) = 2
x→1+
4. O
Expert Solution
This question has been solved!
Explore an expertly crafted, step-by-step solution for a thorough understanding of key concepts.

Step by step
Solved in 2 steps with 2 images

Recommended textbooks for you

College Algebra (MindTap Course List)
Algebra
ISBN:
9781305652231
Author:
R. David Gustafson, Jeff Hughes
Publisher:
Cengage Learning

Algebra & Trigonometry with Analytic Geometry
Algebra
ISBN:
9781133382119
Author:
Swokowski
Publisher:
Cengage
College Algebra (MindTap Course List)
Algebra
ISBN:
9781305652231
Author:
R. David Gustafson, Jeff Hughes
Publisher:
Cengage Learning
Algebra & Trigonometry with Analytic Geometry
Algebra
ISBN:
9781133382119
Author:
Swokowski
Publisher:
Cengage