Let p denote the rate of cancer in the population from which this workforce was drawn. Identify the null and alternative hypotheses. Ho: P H₁: p (Type integers or decimals. Do not round.) Identify the P-value based on the provided data set from technology. P-value = (Round to three decimal places as needed.) State the conclusion about the null hypothesis, as well as the final conclusion that addresses the original claim, and determine what the results suggest about the symbol. the null hypothesis. There sufficient evidence to sample of this workforce is from a population in which the rate of cancer is greater than 40%. the claim that the
Let p denote the rate of cancer in the population from which this workforce was drawn. Identify the null and alternative hypotheses. Ho: P H₁: p (Type integers or decimals. Do not round.) Identify the P-value based on the provided data set from technology. P-value = (Round to three decimal places as needed.) State the conclusion about the null hypothesis, as well as the final conclusion that addresses the original claim, and determine what the results suggest about the symbol. the null hypothesis. There sufficient evidence to sample of this workforce is from a population in which the rate of cancer is greater than 40%. the claim that the

College Algebra (MindTap Course List)
12th Edition
ISBN:9781305652231
Author:R. David Gustafson, Jeff Hughes
Publisher:R. David Gustafson, Jeff Hughes
Chapter8: Sequences, Series, And Probability
Section8.7: Probability
Problem 5E: List the sample space of each experiment. Rolling one die and tossing one coin

Related questions
Question
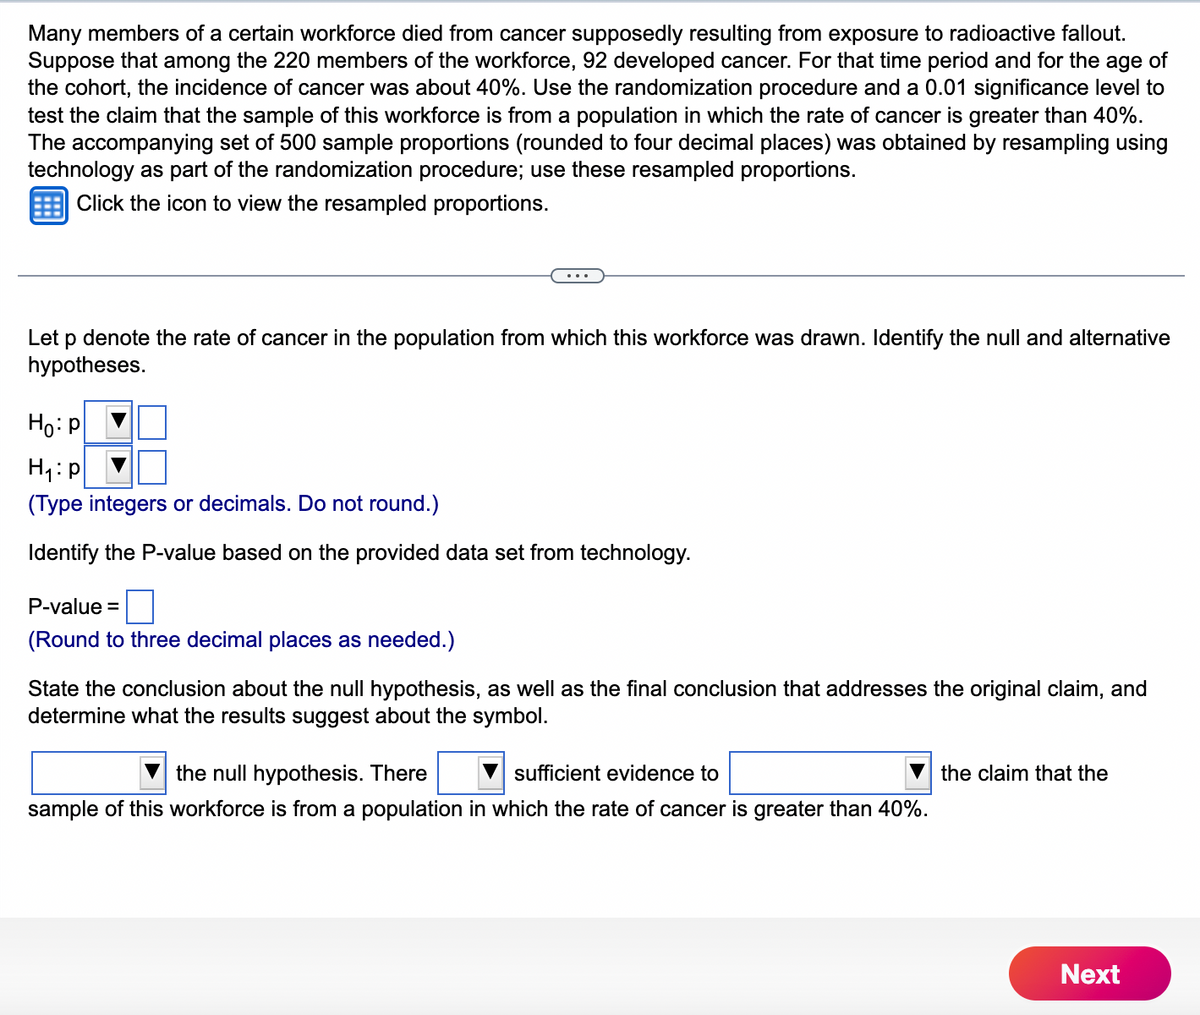
Transcribed Image Text:Many members of a certain workforce died from cancer supposedly resulting from exposure to radioactive fallout.
Suppose that among the 220 members of the workforce, 92 developed cancer. For that time period and for the age of
the cohort, the incidence of cancer was about 40%. Use the randomization procedure and a 0.01 significance level to
test the claim that the sample of this workforce is from a population in which the rate of cancer is greater than 40%.
The accompanying set of 500 sample proportions (rounded to four decimal places) was obtained by resampling using
technology as part of the randomization procedure; use these resampled proportions.
Click the icon to view the resampled proportions.
Let p denote the rate of cancer in the population from which this workforce was drawn. Identify the null and alternative
hypotheses.
Ho: P
H₁: P
(Type integers or decimals. Do not round.)
Identify the P-value based on the provided data set from technology.
P-value=
(Round to three decimal places as needed.)
State the conclusion about the null hypothesis, as well as the final conclusion that addresses the original claim, and
determine what the results suggest about the symbol.
the null hypothesis. There
sufficient evidence to
sample of this workforce is from a population in which the rate of cancer is greater than 40%.
the claim that the
Next
Expert Solution
This question has been solved!
Explore an expertly crafted, step-by-step solution for a thorough understanding of key concepts.

This is a popular solution!

Trending now
This is a popular solution!

Step by step
Solved in 4 steps

Recommended textbooks for you
College Algebra (MindTap Course List)
Algebra
ISBN:
9781305652231
Author:
R. David Gustafson, Jeff Hughes
Publisher:
Cengage Learning
College Algebra (MindTap Course List)
Algebra
ISBN:
9781305652231
Author:
R. David Gustafson, Jeff Hughes
Publisher:
Cengage Learning