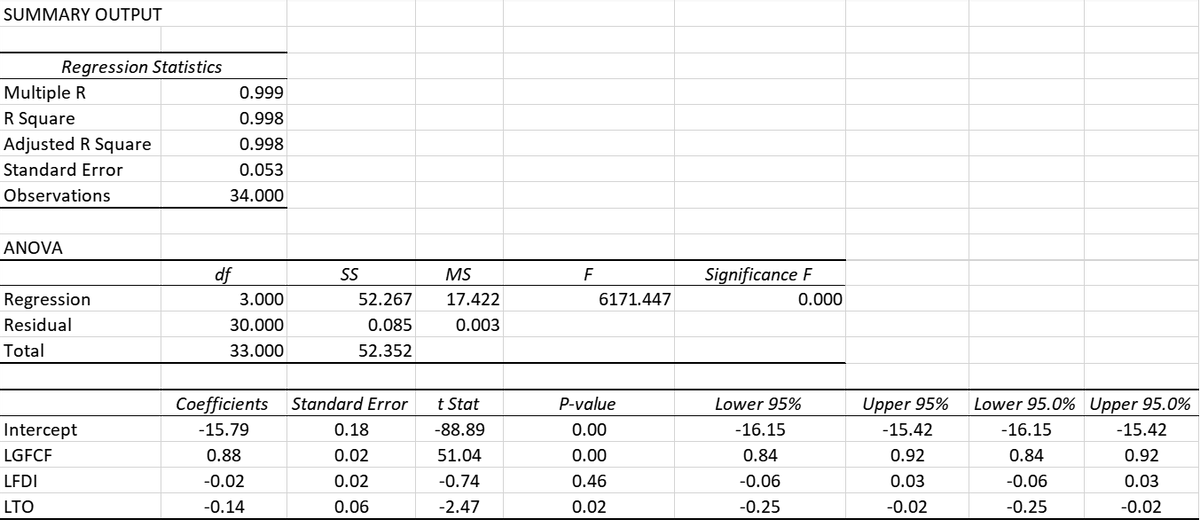
Let us try to find out what is the relationship between the GDP between the gross fixed capital formation(GFCF), trade openness(trade openness), foreign direct investment (FDI).


Q: Outline a general strategy for solving the max-min problem?
A: The process of finding maximum or minimum of a function is known as optimization. We do find maximum…
Q: Determine the one-step-ahead forecast for the demand for January of next year using 6 month moving…
A: The one-step-ahead forecast for the demand for January of next year using 6 month moving average is,…
Q: What is Surplus variables?
A:
Q: Your friend's portfolio manager has suggested two high-yielding stocks: Consolidated Edison (ED) and…
A:
Q: When the federal government incurs additional debt to acquire an asset, under current budgeting…
A: Answer : Increases, does not change
Q: Although natural gas is currently inexpensive and nuclear power currently (and perhaps deservedly)…
A: Plant C S N 1 460.05 687 14 2 452.99 1065 1 3 443.22 1065 1 4 652.32 1065 12 5 642.23…
Q: What does the model predict in the long run?
A: The model can be used to predict the number of days required to infect the entire town.
Q: n, price-demand equation, and equilibrium point in the same coordinate system.
A:
Q: Write basic steps of developing a LP MODEL?
A: The steps for developing a LP model are as follows 1.First define the variables 2. Write the…
Q: How to formulate the model of blood loss?
A: Given: A typical volume of blood in the human body is about 5 L. A certain percentage of that volume…
Q: What is the Applications and importance of calculus for biotechnology the exponentional growth curve…
A: To write the applications and importance of calculus for biotechnology the exponential growth curve…
Q: State the formula for the Present Value of a Continuous Stream of Income.
A: State the formula for the Present Value of a Continuous Stream of Income.
Q: Suppose 275 trout are seeded into a lake. Absent constraint, their population will grow by 75% a…
A: Given problem Given that Suppose 275 trout are seeded into a lake. Absent constraint, their…
Q: What is the Equilibrium Price (Rs) and quantity (units) demanded for X on the market? Use a diagram…
A: Here is the diagram of supply and demand:
Q: What is the average growth in average sales per agent per month from March to May target? *
A: Here given chart of 2016 sales in different categories And no of transaction agent per month also…
Q: Compute the rate of return for investment represented by the following cash flow: (Ans.10.83%)…
A: Internal rate of return is a discount rate that make the net present value of future cash flow is…
Q: What is the third equation after the slack variable is introduced?
A: Given, Maximize: z=9x1+3x2subject to 7x1-x2≤162 15x1+6x2≤229…
Q: A retired couple wishes to invest $750,000, diversifying the investment in three areas: a high-risk…
A:
Q: Answer the question on the basis of the following short run demand and cost data for a specific…
A: answer is in next step
Q: Compute the total and annual returns on the described investment. Four years after buying 600 shares…
A: Given :- Four years after buying 600 shares of XYZ stock for $ 45 per share , you sell the stock…
Q: Suppose 150 trout are seeded into a lake. Absent constraint, their population will grow by 35% a…
A:
Q: 9) MARKET EQUILIBRIUM
A: Demand = -0.4q + 300 Supply = 0.2q
Q: Suppose 175 trout are seeded into a lake. Absent constraint, their population will grow by 60% a…
A: Recall: Logistic growth model P(t)=m1+m-PPe-ktWe have, P=175, m=2000, k=60%=0.60, t=5 years
Q: Find the point of diminishing returns for the revenue function
A: The objective here is to find the point of diminishing returns for the given revenue function:…
Q: Describe elasticity of demand in your own words.
A: Elasticity of Demand A change in the price of a commodity affects its demand. We can find the…
Q: Can we use "OLS Regression Model" as a method to examine the relationship of Education and Income…
A: Given information: The investigator is specially interested to study the impact of education level…
Q: n, is this a good investment? *
A: Here A local club plans to invest $10000 to host a baseball game. They expect to sell tickets worth…
Q: Show in a flow diagram a sequence of steps in conducting a quantitative analysis and explain the…
A: Introduction :- We have to explain steps involved in quantitative analysis through flow diagram.…
Q: b) Explain what is meant by the internal rate of return (IRR) in the context of project appraisal.…
A: The internal rate of return is the discount rate that sets the present value of all cash inflows of…
Q: Find the production schedule for the technology matrix and demand vector given below:
A: Given that A=0.10.20.31.40.41.50.400.2andD=357 to find the production schedule for given technology…
Q: Suppose 275 trout are seeded into a lake. Absent constraint, their population will grow by 50% a…
A:
Q: Economist A.W. Phillips was one of the first economists to present compelling evidence of the…
A: A regression equation is a numerical relationship between a response or a dependent variable and the…
Q: What are stockout costs and capacity-associated costs? What is their relationship to inventories?
A: Stockout cost is the lost income and expense associated with a shortage of inventory .This cost can…
Q: Demand for stereo headphones and MP3 players for joggers has caused Nina Industries to grow almost…
A: Given Month demand January 4000 February 4100 March 3800 April 4200 May 4850 June…
Q: Explain the term Linearity?
A: When there are two quantitative variables, as one variable increases/decreases, the other variable…
Q: The Shrinking Rainy Day Fund. On October 5, 2015 The Boston Globe published a story headlined…
A: Calculation:Compute the total state spending as of summer of 2007 as follows.
Q: Explain the term "Autoregressions"? Define The First-Order Autoregressive Model?
A: Here {Xt} is regressed on past values of Xt, hence the prefix "auto". Autoregressive models of order…
Q: Compute the estimated regression equation that relates years of experience to annual sales.
A: Given data, X Y X*Y X*X 1 80 80 1 4 102 408 16 6 103 618 36 10 119 1190 100 13 136 1768…
Q: Define carrying capacity constant.
A: Query- Define carrying capacity constant. Answer- The carrying capacity is the theoretical…
Q: 5. How is the flow of investors' money into stock mutual funds related to the flow of money into…
A: Introduction: Denote β1 as the true slope corresponding to the predictor Stock.
Q: Define regression analysis
A: Regression analysis is a statistical method used for finding the relationship between the dependent…
Q: Which Law states that the quantity demanded will increase as the price of the product decreases? Law…
A:
Q: distinguish between the unit of analysis and the aggregates?
A: The unit of analysis refers to the major parameter that is being investigated in study. The obvious…
Q: This year, FCF Inc. has earnings before interest and taxes of $9,710,000, depreciation expenses of…
A: Note that , Free Cash Flow : The free cash flow represents the operating cash flow after meeting…
Q: Incremental revenue is relevant in decision-making.
A:
Q: Define linearization?
A: it is a method of finding the linear approximation of a function at a given point. If f is…
Q: How does time-period or length of run affects the behavior of the supply function?
A: Answer:
Let us try to find out what is the relationship between the GDP between the gross fixed capital formation(GFCF), trade openness(trade openness), foreign direct investment (FDI).

Step by step
Solved in 2 steps with 2 images

- The output of a solar panel (photovoltaic) system depends on its size. A manufacturer states that the average daily production of its 1.5 kW system is 6.6 kilowatt hours (kWh) for Perth conditions. A consumer group monitored this 1.5 kW system in 20 different Perth homes and measured the average daily production by the systems in these homes over a one month period during October. The data is provided here. (a) Analyse the consumer group’s data to test if the manufacturer’s claim of an average of 6.6 kWh per day is reasonable. State appropriate hypotheses, assumptions and decision rule at α = 0.10. What conclusions would you report to the consumer group? Hint: You will need to find Descriptive Statistics first.) (b) If 48 homes in the central Australian city of Alice Springs had this system installed and similar data wascollected, in order to assess whether average daily production in Alice Springs exceeded 6.6 kWh, (i) what would the alternate hypothesis be? (ii) What would be the…Overhead Door (OD) Corporation’s founder, C. G. Johnson, invented the upward-lifting garage door in 1921 and the electric garage door opener in 1926. Since then OD has been a leading supplier of commercial, industrial, and residential garage doors sold through a nationwide network of more than 450 authorized distributors. They have built a solid reputation as a premier door supplier, commanding 15 % share of the market. Suppose that customers assess door quality first in terms of the ease of operation, followed by its durability. The quality improvement team (QIT) might then assign an engineering team to determine the factors that contribute to these two main problems. Smooth operation of a garage door is a critical quality characteristic that affects both problems: If a door is too heavy, it’s difficult and unsafe to balance and operate; if it’s too light, it tends to buckle and break down frequently or may not close properly. Suppose the design engineers determine that a standard…Department of Agriculture is concerned about the number of acres of farmland being withdrawn from farming. The department would like to propose new legislation to prevent this but wants to show the legislature what would happen if it does not act. Drew Johnson, the department’s statistician, regresses the number of acres used for farming in the state on time. Johnson finds the following: Model Summary Model R R Square Adjusted R Square Std. Error of the Estimate 1 .943a .890 .795 3.2875 a. Predictors: (Constant), Number of Years ANOVAb Model Sum of Squares df Mean Square F Sig. 1 Regression 1378.458 1 1378.458 141.149 .000a Residual 478.567 49 9.766 Total 1857.025 50 a. Predictors: (Constant), Number of Years b. Dependent Variable: Acres (in Millions) Coefficientsa Model Unstandardized Coefficients Standardized Coefficients t Sig. B Std.…
- Company Type Total Revenues Total Assets Return on Equity Earnings per Share Average Yield Dividends per Share Average P/E Ratio AFLAC 6 7251 29454 17.1 2.08 0.9 0.22 11.5 Albertson's 4 14690 5219 21.4 2.08 1.6 0.63 19 Allstate 6 20106 80918 20.1 3.56 1 0.36 10.6 Amerada Hess 7 8340 7935 0.2 0.08 1.1 0.6 698.3 American General 6 3362 80620 7.1 2.19 3 1.4 21.2 American Stores 4 19139 8536 12.2 1.01 1.4 0.34 23.5 Amoco 7 36287 32489 16.7 2.76 3.1 1.4 16.1 Arco Chemical 2 3995 4116 6.2 1.14 6.1 2.8 40.4 Ashland 7 14319 7777 9.5 3.8 2.3 1.1 12.4 Atlantic Richfield 7 19272 25322 21.8 5.41 3.8 2.83 3.8 Bausch & Lomb 5 1916 2773 6 0.89 2.6 1.04 2.6 Baxter International 5 6138 8707 11.5 1.06 2.3 1.13 47.2 Bristol-Myers Squibb 5 16701 14977 44.4 3.14 2 1.52 24.1 Burlington Coat 1 1777 775 12.3 1.18 0.1 0.02 12.9 Central Maine Power 3 954 2299 2.4 0.16 7.8 0.9 79.6 Chevron 7 41950 35473 18.6 4.95 3 2.28 15.2 CIGNA 6 14935 108199 13.7 4.88 2 1.1 11.4…Period People (Y) Ocupation percentage (X) 2009 1T 46,977,904 59.7 2009 2T 47,453,163 59.3 2009 3T 48,738,589 60.2 2009 4T 48,903,792 60.4 2010 1T 48,069,274 59.9 2010 2T 49,133,132 60.2 2010 3T 49,190,032 58.7 2010 4T 48,478,718 58.8 2011 1T 48,505,168 59.3 2011 2T 49,482,112 59.5 2011 3T 50,127,032 59.7 2011 4T 50,772,496 60.5 2012 1T 50,192,842 60.3 2012 2T 51,477,178 60.7 2012 3T 51,927,050 60.7 2012 4T 51,317,999 60 2013 1T 50,847,242 60 2013 2T 51,895,865 60.4 2013 3T 52,034,353 60.2 2013 4T 52,370,886 60.7 2014 1T 51,559,018 60.3 2014 2T 51,836,752 59.8 2014 3T 52,192,043 59.6 2014 4T 52,108,400 59.4 2015 1T 52,007,842 59.7 2015 2T 52,623,721 59.6 2015 3T 53,179,919 59.7 2015 4T 53,809,017 60.3 2016 1T 52,918,649 59.7 2016 2T 53,539,565 59.6 2016 3T 54,226,803 59.9 2016 4T 54,034,800 59.6 2017 1T 53,681,720 59.7 2017 2T 54,068,791 59.3 2017 3T 54,369,915 59.1 2017 4T 54,696,638 59.3 2018 1T 54,590,773…Med-Tech labs is a facility that provides medical tests andevaluations for patients, ranging from analyzing blood samplesto performing magnetic resonance imaging (MRI). Averagecost to patients is $60 per patient. Labor costs average $15 perpatient, materials costs are $20 per patient, and overhead costs areaveraged at $20 per patient.(a) What is the multifactor productivity ratio for Med-Tech?What does your fi nding mean?(b) If the average lab worker spends three hours for eachpatient, what is the labor productivity ratio?
- The output level of a firm is gien by Q = 50√LK Assume that the firm has orders for 1000 units of output. The price of labor is given N$5 per unit and the price of capital is N$20 per unit. Using the Lagrangian, 1 find the cost-minimizing combination of inputs 2 find the value of λ and interprete. 3 Calculate the total cost, Average total costcontinuing from : https://www.bartleby.com/questions-and-answers/the-director-of-a-shipping-company-believes-that-there-is-a-relationship-between-the-cost-of-a-custo/1e628848-c280-4972-a21b-5454693b3fcdFuel economy A consumer organization has reported test data for 50 car models. We will examine the asso-ciation between the weight of the car (in thousands of pounds) and the fuel efficiency (in miles per gallon).Here are the scatterplot, summary statistics, andregression analysis:Variable Count Mean StdDevMPG 50 25.0200 4.83394wt/1000 50 2.88780 0.511656Dependent variable is: MPGR-squared = 75.6%s = 2.413 with 50 - 2 = 48 dfVariable Coefficient SE(Coeff) t-ratio P-valueIntercept 48.7393 1.976 24.7 ...0.0001Weight -8.21362 0.6738 -12.2 ...0.0001 a) Is there strong evidence of an association between the weight of a car and its gas mileage? Write an appropri-ate hypothesis. b) Are the assumptions for regression satisfied?c) Test your hypothesis and state your conclusion.
- A manufacturer of high-resolution video terminals must control the tension on the mesh of fine wires that lies behind the surface of the viewing screen. Too much tension will tear the mesh, and too little will allow wrinkles. The tension is measured by an electrical device with output readings in millivolts (mV). Some variation is inherent in the production process. Here are the tension readings from a random sample of 20 screens from a single day’s production: 269.5 297.0 269.6 283.3 304.8 280.4 233.5 257.4 317.5 327.4 264.7 307.7 310.0 343.3 328.1 342.6 338.8 340.1 374.6 336.1 From this data, we compute ? = 306.32, ? = 36.21 Compute a 90% confidence interval for the mean tension μ of all the screens produced on this day.Department of Agriculture is concerned about the number of acres of farmland being withdrawn from farming. The department would like to propose new legislation to prevent this but wants to show the legislature what would happen if it does not act. the department’s statistician, regresses the number of acres used for farming in the state on time. finds the following: Model Summary Model R R Square Adjusted R Square Std. Error of the Estimate 1 .943a .890 .795 3.2875 a. Predictors: (Constant), Number of Years ANOVAb Model Sum of Squares df Mean Square F Sig. 1 Regression 1378.458 1 1378.458 141.149 .000a Residual 478.567 49 9.766 Total 1857.025 50 a. Predictors: (Constant), Number of Years b. Dependent Variable: Acres (in Millions) Coefficientsa Model Unstandardized Coefficients Standardized Coefficients t Sig. B Std. Error Beta 1…High Cholesterol: A group of eight individuals with high cholesterol levels were given a new drug that was designed to lower cholesterol levels. Cholesterol levels, in milligrams per deciliter, were measured before and after treatment for each individual, with the following results: Individual Before After 1 264 187 2 288 216 3 274 188 4 278 200 5 283 173 6 271 224 7 295 171 8 275 187 Send data to Excel Part: 0 / 2 0 of 2 Parts Complete Part 1 of 2 (a) Use a calculator to construct a 90% confidence interval for the mean reduction in cholesterol level. Round your answers to at least one decimal place. The confidence interval for the mean reduction in cholesterol level is , .

