Let x be a random variable representing percentage change in neighborhood population in the past few years, and let y be a random variable representing crime rate (crimes per 1000 population). A random sample of six Denver neighborhoods gave the following information. x 30 2 11 17 79 6 y 177 34 132 127 69 53 LAUSE SALT Ex=73; Ey=592; ²-1,399; 2y²-73,608; Exy - 9,790 (a) Find x, y, b, and the equation of the least-squares line. (Round your answers for x and y to two decimal places. Round your least-squares estimates to three decimal places.) x= y= 9- (b) Draw a scatter diagram for the data. Plot the least-squares line on your scatter diagram. y 200 150 VV 100 200 150 100 O 50 200 150 100 200 150 Vy 100 50 50 5 10 15 20 25 30 35 x 10 15 20 25 O 30 X 5 10 15 20 25 30 35 5 10 15 20 25 30 35 O O (c) Find the sample correlation coefficient r and the coefficient of determination. (Round your answers to three decimal places.) 2.5 What percentage of variation in y is explained by the least-squares model? (Round your answer to one decimal place.)
Let x be a random variable representing percentage change in neighborhood population in the past few years, and let y be a random variable representing crime rate (crimes per 1000 population). A random sample of six Denver neighborhoods gave the following information. x 30 2 11 17 79 6 y 177 34 132 127 69 53 LAUSE SALT Ex=73; Ey=592; ²-1,399; 2y²-73,608; Exy - 9,790 (a) Find x, y, b, and the equation of the least-squares line. (Round your answers for x and y to two decimal places. Round your least-squares estimates to three decimal places.) x= y= 9- (b) Draw a scatter diagram for the data. Plot the least-squares line on your scatter diagram. y 200 150 VV 100 200 150 100 O 50 200 150 100 200 150 Vy 100 50 50 5 10 15 20 25 30 35 x 10 15 20 25 O 30 X 5 10 15 20 25 30 35 5 10 15 20 25 30 35 O O (c) Find the sample correlation coefficient r and the coefficient of determination. (Round your answers to three decimal places.) 2.5 What percentage of variation in y is explained by the least-squares model? (Round your answer to one decimal place.)

Algebra & Trigonometry with Analytic Geometry
13th Edition
ISBN:9781133382119
Author:Swokowski
Publisher:Swokowski
Chapter10: Sequences, Series, And Probability
Section10.8: Probability
Problem 29E

Related questions
Question
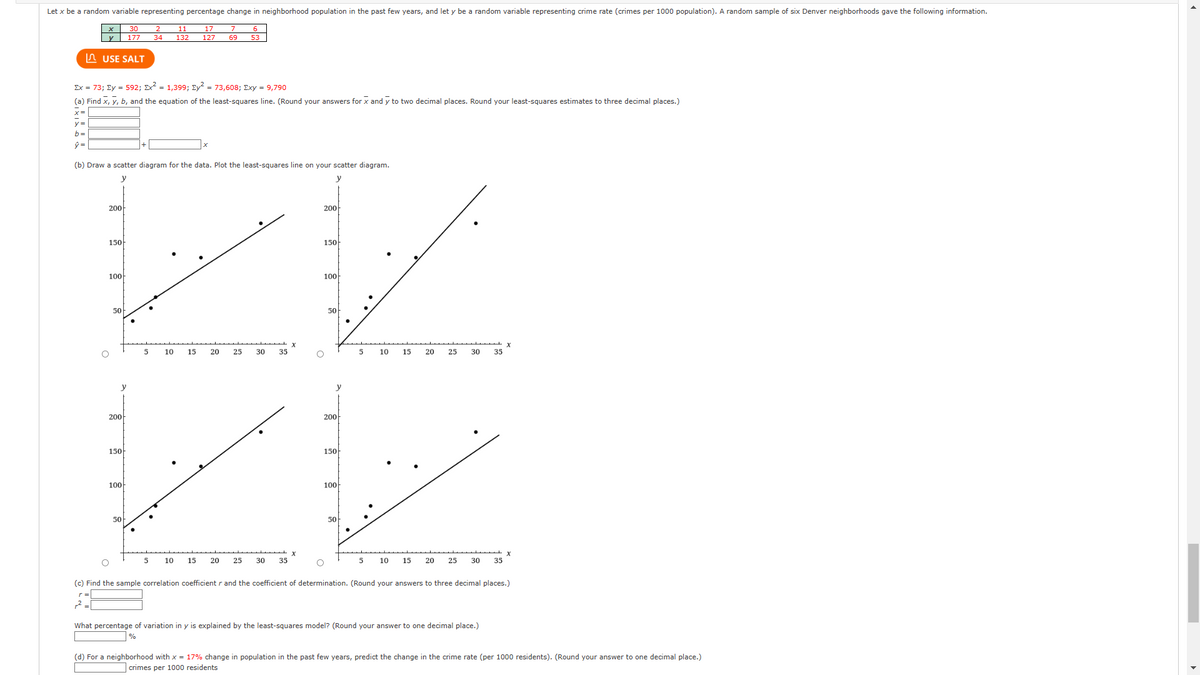
Transcribed Image Text:Let x be a random variable representing percentage change in neighborhood population in the past few years, and let y be a random variable representing crime rate (crimes per 1000 population). A random sample of six Denver neighborhoods gave the following information.
30 2 11 17
177 34 132 127
X
y=
b=
ŷ =
USE SALT
Ex = 73; Ey = 592; Ex² = 1,399; Ey² = 73,608; Exy = 9,790
(a) Find x, y, b, and the equation of the least-squares line. (Round your answers for x and y to two decimal places. Round your least-squares estimates to three decimal places.)
x=
(b) Draw a scatter diagram for the data. Plot the least-squares line on your scatter diagram.
y
y
200
150
XV
100
50
X
200
150
100
50
200
150
100
50
5 10 15 20 25
7
69 53
5
200
150
Vy
100
50
10
15
20
30 35
25
O
35
5
10
X
15 20 25 30 35
5 10
15 20 25
30 35
O
(c) Find the sample correlation coefficient r and the coefficient of determination. (Round your answers to three decimal places.)
r² =
What percentage of variation in y is explained by the least-squares model? (Round your answer to one decimal place.)
%
(d) For a neighborhood with x = 17% change in population in the past few years, predict the change in the crime rate (per 1000 residents). (Round your answer to one decimal place.)
crimes per 1000 residents
▸
Expert Solution
This question has been solved!
Explore an expertly crafted, step-by-step solution for a thorough understanding of key concepts.

Step by step
Solved in 5 steps with 1 images

Recommended textbooks for you
Algebra & Trigonometry with Analytic Geometry
Algebra
ISBN:
9781133382119
Author:
Swokowski
Publisher:
Cengage
Algebra & Trigonometry with Analytic Geometry
Algebra
ISBN:
9781133382119
Author:
Swokowski
Publisher:
Cengage