Workers and senior-level bosses were asked if it was seriously unethical to monitor employee e-mail. The results are summarized in the table to the right. Use a 0.05 significance level to test the claim that the response is independent of whether the subject is a worker or a boss. Click the icon to view the critical values of x² table. Workers Bosses Yes No Q 192 245 40 83 a. State the null and the alternative hypotheses. Choose the correct answer below. O A. The null hypothesis: There is some relationship between response and whether the subject is a worker or a senior-level boss. The alternative hypothesis: Response is independent of whether the subject is a worker or a senior-level boss. C... OB. The null hypothesis: Response is independent of whether the subject is a worker or a senior-level boss. The alternative hypothesis: There is some relationship between response and whether the subject is a worker or a senior-level boss. Workers Bosses (Round to the nearest tenth as needed.) c. Find the value of the x² test statistic. x² = (Round to the nearest hundredth as needed.) [ d. Use the given significance level to find the x² critical value. The critical value is b. Assuming independence between the two variables, find the expected frequency for each cell of the table. Table of expected frequencies Yes No O O (Round to the nearest thousandth as needed.) e. Using the given significance level, complete the test of the claim that the two variables are independent. State the conclusion that addresses the original claim. Choose the correct answer below. There does not appear to be a relationship between response and whether the subject is a worker or a senior-level boss. There does appear to be a relationship between response and whether the subject is a worker or a senior-level boss.
Workers and senior-level bosses were asked if it was seriously unethical to monitor employee e-mail. The results are summarized in the table to the right. Use a 0.05 significance level to test the claim that the response is independent of whether the subject is a worker or a boss. Click the icon to view the critical values of x² table. Workers Bosses Yes No Q 192 245 40 83 a. State the null and the alternative hypotheses. Choose the correct answer below. O A. The null hypothesis: There is some relationship between response and whether the subject is a worker or a senior-level boss. The alternative hypothesis: Response is independent of whether the subject is a worker or a senior-level boss. C... OB. The null hypothesis: Response is independent of whether the subject is a worker or a senior-level boss. The alternative hypothesis: There is some relationship between response and whether the subject is a worker or a senior-level boss. Workers Bosses (Round to the nearest tenth as needed.) c. Find the value of the x² test statistic. x² = (Round to the nearest hundredth as needed.) [ d. Use the given significance level to find the x² critical value. The critical value is b. Assuming independence between the two variables, find the expected frequency for each cell of the table. Table of expected frequencies Yes No O O (Round to the nearest thousandth as needed.) e. Using the given significance level, complete the test of the claim that the two variables are independent. State the conclusion that addresses the original claim. Choose the correct answer below. There does not appear to be a relationship between response and whether the subject is a worker or a senior-level boss. There does appear to be a relationship between response and whether the subject is a worker or a senior-level boss.

MATLAB: An Introduction with Applications
6th Edition
ISBN:9781119256830
Author:Amos Gilat
Publisher:Amos Gilat
Chapter1: Starting With Matlab
Section: Chapter Questions
Problem 1P

Related questions
Question
Please assist with question I am lost
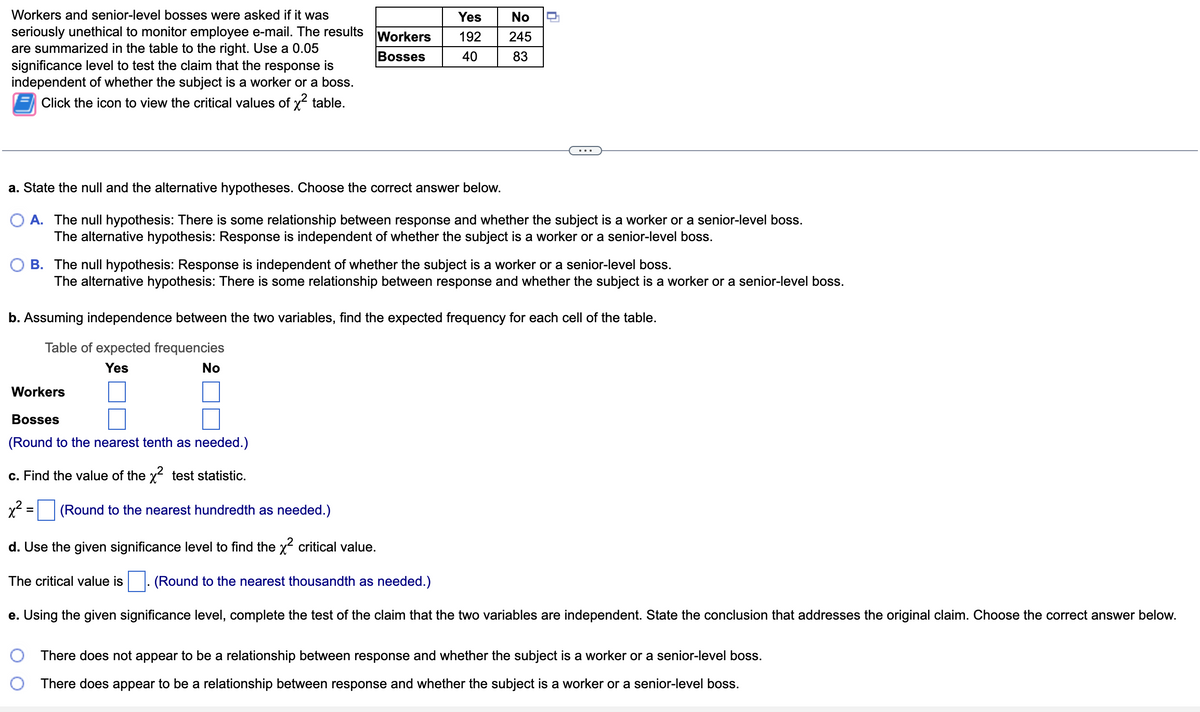
Transcribed Image Text:Workers and senior-level bosses were asked if it was
seriously unethical to monitor employee e-mail. The results
are summarized in the table to the right. Use a 0.05
significance level to test the claim that the response is
independent of whether the subject is a worker or a boss.
Click the icon to view the critical values of x² table.
Workers
Bosses
Yes
192
40
No
245
83
a. State the null and the alternative hypotheses. Choose the correct answer below.
A. The null hypothesis: There is some relationship between response and whether the subject is a worker or a senior-level boss.
The alternative hypothesis: Response is independent of whether the subject is a worker or a senior-level boss.
Workers
Bosses
(Round to the nearest tenth as needed.)
c. Find the value of the x² test statistic.
x² = (Round to the nearest hundredth as needed.)
d. Use the given significance level to find the x² critical value.
0
B. The null hypothesis: Response is independent of whether the subject is a worker or a senior-level boss.
The alternative hypothesis: There is some relationship between response and whether the subject is a worker or a senior-level boss.
The critical value is
b. Assuming independence between the two variables, find the expected frequency for each cell of the table.
Table of expected frequencies
Yes
No
(Round to the nearest thousandth as needed.)
e. Using the given significance level, complete the test of the claim that the two variables are independent. State the conclusion that addresses the original claim. Choose the correct answer below.
There does not appear to be a relationship between response and whether the subject is a worker or a senior-level boss.
There does appear to be a relationship between response and whether the subject is a worker or a senior-level boss.
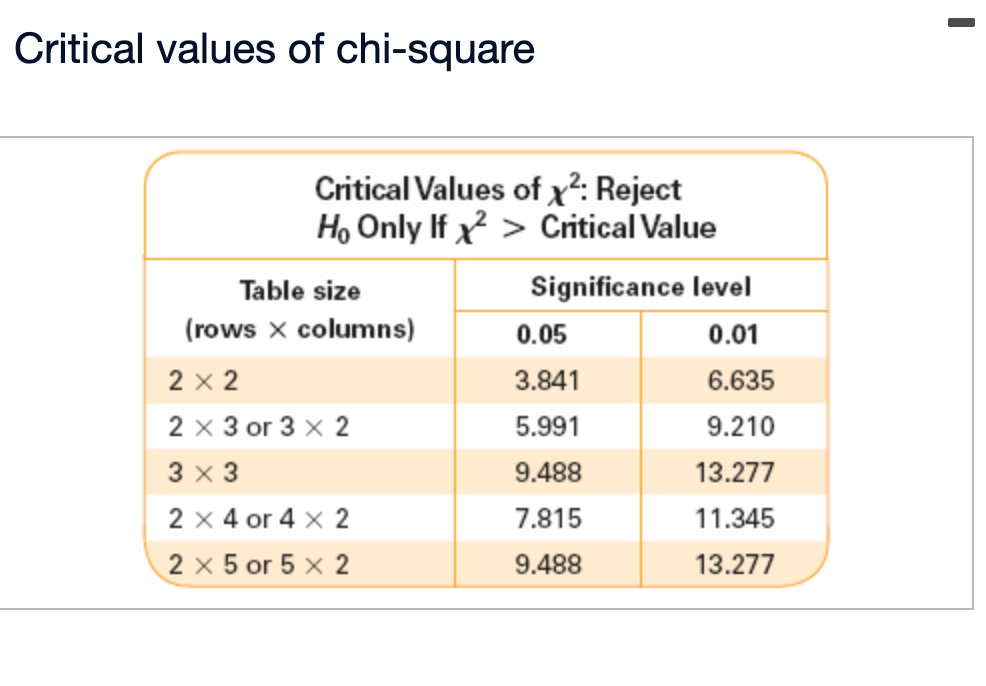
Transcribed Image Text:Critical values of chi-square
Critical Values of x²: Reject
Ho Only If x² > Critical Value
Table size
(rows x columns)
2 x 2
2 x 3 or 3 x 2
3 x 3
2 x 4 or 4 x 2
2 x 5 or 5 x 2
Significance level
0.01
6.635
9.210
13.277
11.345
13.277
0.05
3.841
5.991
9.488
7.815
9.488
I
Expert Solution
This question has been solved!
Explore an expertly crafted, step-by-step solution for a thorough understanding of key concepts.

This is a popular solution!

Trending now
This is a popular solution!

Step by step
Solved in 2 steps with 2 images

Recommended textbooks for you
MATLAB: An Introduction with Applications
Statistics
ISBN:
9781119256830
Author:
Amos Gilat
Publisher:
John Wiley & Sons Inc

Probability and Statistics for Engineering and th…
Statistics
ISBN:
9781305251809
Author:
Jay L. Devore
Publisher:
Cengage Learning

Statistics for The Behavioral Sciences (MindTap C…
Statistics
ISBN:
9781305504912
Author:
Frederick J Gravetter, Larry B. Wallnau
Publisher:
Cengage Learning
MATLAB: An Introduction with Applications
Statistics
ISBN:
9781119256830
Author:
Amos Gilat
Publisher:
John Wiley & Sons Inc
Probability and Statistics for Engineering and th…
Statistics
ISBN:
9781305251809
Author:
Jay L. Devore
Publisher:
Cengage Learning
Statistics for The Behavioral Sciences (MindTap C…
Statistics
ISBN:
9781305504912
Author:
Frederick J Gravetter, Larry B. Wallnau
Publisher:
Cengage Learning

Elementary Statistics: Picturing the World (7th E…
Statistics
ISBN:
9780134683416
Author:
Ron Larson, Betsy Farber
Publisher:
PEARSON

The Basic Practice of Statistics
Statistics
ISBN:
9781319042578
Author:
David S. Moore, William I. Notz, Michael A. Fligner
Publisher:
W. H. Freeman

Introduction to the Practice of Statistics
Statistics
ISBN:
9781319013387
Author:
David S. Moore, George P. McCabe, Bruce A. Craig
Publisher:
W. H. Freeman